. 2013 Apr 15;2(Spec Iss):S0010. doi: 10.5702/massspectrometry.S0010

Fig. 1. xy (left) and yz (middle) projections of ion clouds taken at 0.5 s after excitation and time-domain ICR signals (right, 0.5 s of duration) m/z=500, at 7 T for (A)—1,000 singly charged ions in Quadrupolar trapping potential; (B) 1,000 singly charged ions (C) 10,000 singly charged ions in open ICR cell geometry (Finnigan LTQ-FT, without grid).
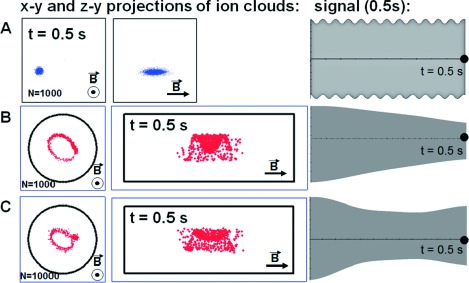
Fig. 1. x–y (left) and y–z (middle) projections of ion clouds taken at 0.5 s after excitation and time-domain ICR signals (right, 0.5 s of duration) m/z=500, at 7 T for (A)—1,000 singly charged ions in Quadrupolar trapping potential; (B) 1,000 singly charged ions (C) 10,000 singly charged ions in open ICR cell geometry (Finnigan LTQ-FT, without grid).