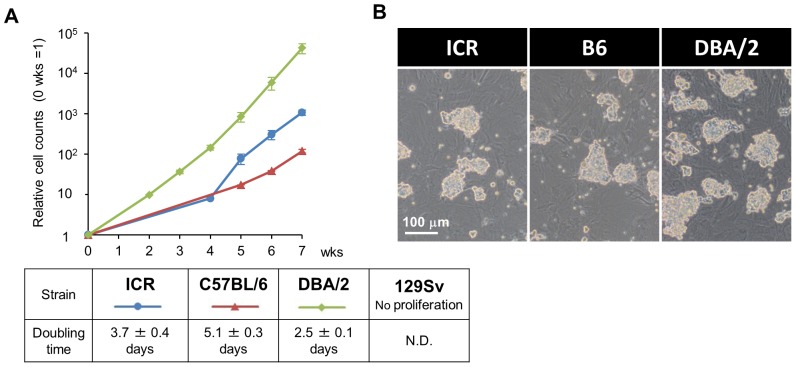
Figure 4. SSCs derived from ICR and B6 can be cultured under the alternative conditions.
(A) Growth curves of SSCs derived from ICR, B6 and DBA/2 mice (left panel), summarized in the table (right panel). The number of SSCs was counted at the indicated time points, and cell counts are presented as means ± s.d. from three independent experiments. The calculated doubling times are also shown in the table (right panel). (B) Phase contrast images of SSC colonies derived from ICR, B6 and DBA/2 mice. Scale bar, 100 µm.

