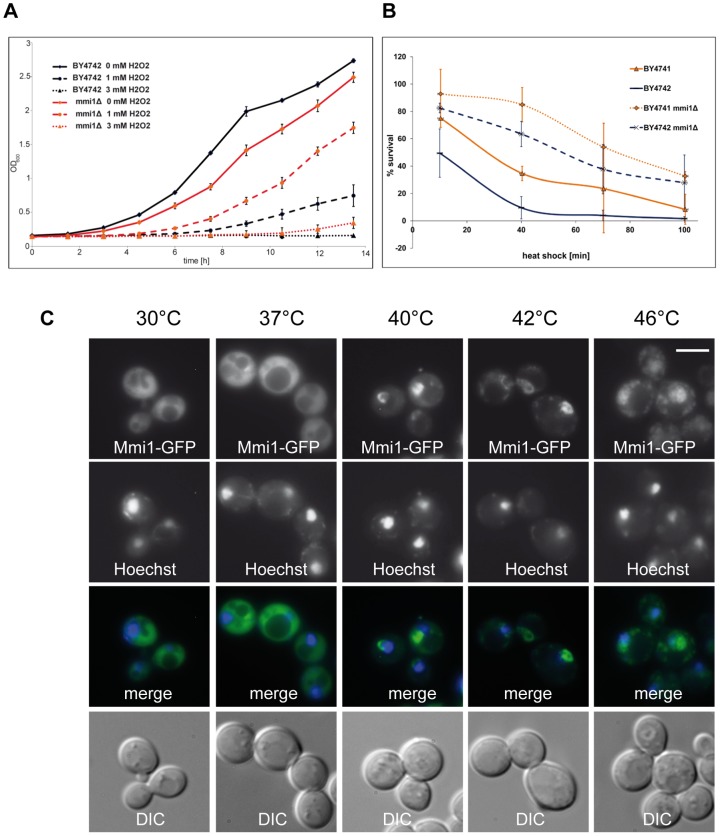
Figure 3. Mmi1 in times of stress.
(A) Growth curves of BY4742 wild type (WT) cells as well as mmi1Δ cells in the BY4742 strain (strain CRY1981) with and without the addition of 1 mM and 3 mM hydrogen peroxide. (B) Survival of WT and mmi1Δ cells of both mating types (strains BY4741, BY4742, CRY1107, CRY1981) after a temperature shift from 30°C to 46°C for time periods of up to 100 min. Note the very marked increase of heat shock resistance of the deletion mutants. Error bars denote standard deviations of the mean obtained form 3 independent repeats of the experiment. (C) Changes of Mmi1-GFP distribution after a temperature shift from 30°C to 37°C, 40°C, 42°C and 46°C for 10 min each (strain CRY1838). Scale bar 4 µm. The figures show transfer of Mmi1 to part of the nuclear compartment at intermediate temperatures and transfer to both the nucleus and cytoplasmic granules upon 10 min heat shock at 46°C.

