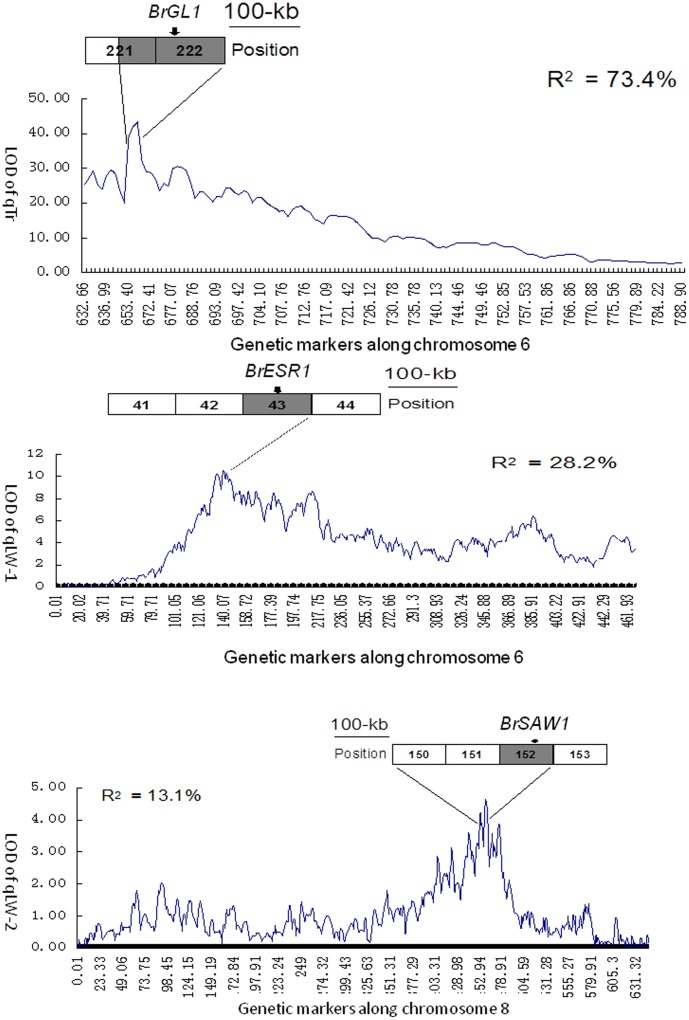
Figure 5. Precise locations of three QTLs and candidate genes.
Curves indicate chromosomal locations and LOD values of detected QTLs. Names and phenotypic effect (R2) of the QTLs are indicated. Recombination bins near the LOD peaks of the QTL are illustrated as horizontal bars with their numbers labeled inside. Shaded bin overlaps the LOD peak of a QTL. The portion of a curve and corresponding bins defining the 95% confidence interval of a QTL are bracketed by two lines. The relative physical position of a candidate gene in the bin is indicated by an arrow head.

