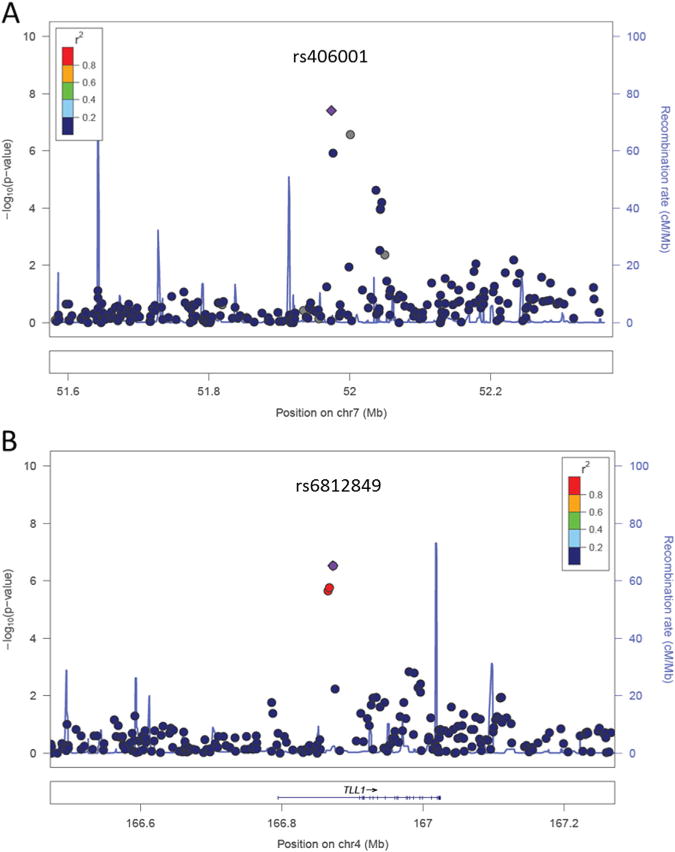
Figure 2.

Regional Manhattan plots of the top two strongest association regions in European Americans: chromosome 7p12 (A) and chromosome 4q32 (B). The single nucleotide polymorphisms are color coded based on the linkage disequilibrium with the most significant single nucleotide polymorphism in each region, rs406001 and rs6812849, respectively.
