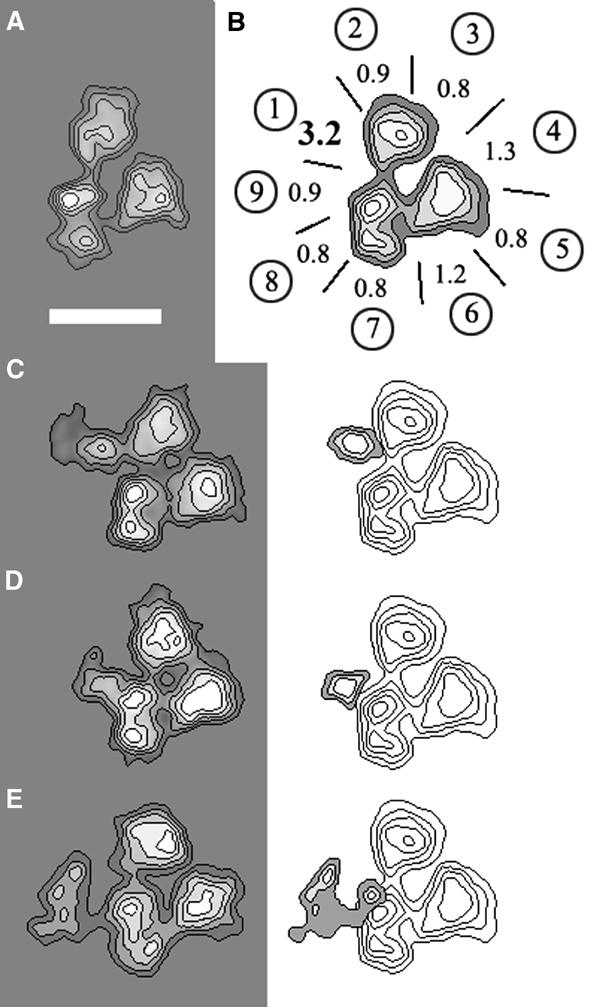
Figure 1.

Immunolabelling of TBP. (A) Characteristic trilobed view of TFIID that is used throughout this report to identify the antibody-labelled site, represented with isodensity contour levels. (B) Mapping of the TBP-specific pAb-binding site at the outer contour of the trilobed TFIID view. Each lobe A, B and C is divided into three sectors labelled as in Table I (A 1,2,3; B 4,5,6; C 7,8,9). The values indicated for each sector represent deviations from the average binding frequency (in sigma folds). (C, D) Average images of TFIID molecules specifically labelled with the anti-TBP pAb (left panel) and density difference map with an unlabelled TFIID (right panel). (E) Average image of TFIID molecules in which the N-terminally HA-tagged TBP is labelled with an anti-HA antibody (left panel) and difference map with an unlabelled TFIID molecule (right panel). The bar represents 15 nm.
