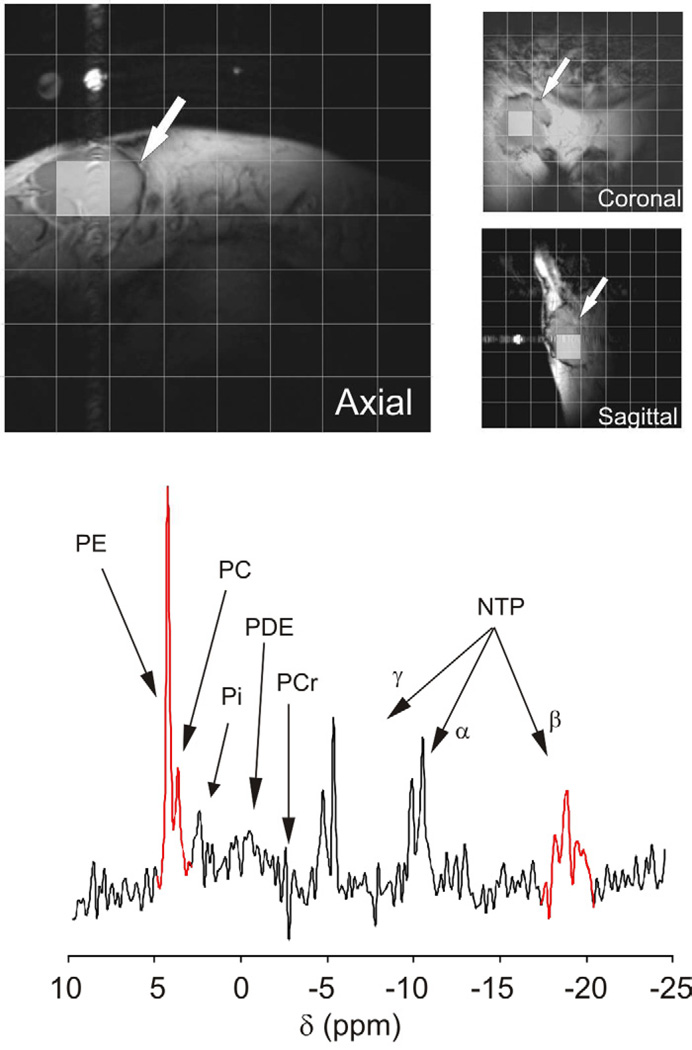
Figure 1. Example of the noninvasive 3D-localized 31P MRS exam from a target tumor mass of a DLBCL patient.
Top, T1-weighted Spin-Echo MR images acquired in the three orthogonal orientations from the right inguinal area of a newly diagnosed DLBCL patient are shown. In the images a tumor mass of approximately 32–35 millimeters in each diameter is shown (white arrows). Each image is overlaid with a grid representing the projection of the 3-dimensional acquisition matrix of voxels where 31P spectral signals were localized. Shaded in grey are the 2D projections of a voxel that was included in the tumor mass. Bottom, The 31P spectrum of the voxel highlighted in the images is shown with corresponding peak assignments (PE, phosphoethanolamine; PC, phosphocreatine; Pi, inorganic phosphate; PDE, the phosphodiester region; PCr, location of the phosphocreatine signal [not present in the tumor spectrum but prominent in the spectra of surrounding muscle; and NTP, the α, β, and γ phosphates of nucleoside triphosphates). The sum of the phosphomonoester (PME) signals phosphoethanolamine (PE) and phosphocholine (PC) and the triplet of the Pβ of NTP (highlighted in red in the spectrum) were integrated to obtain the tumor PME/NTP value.

