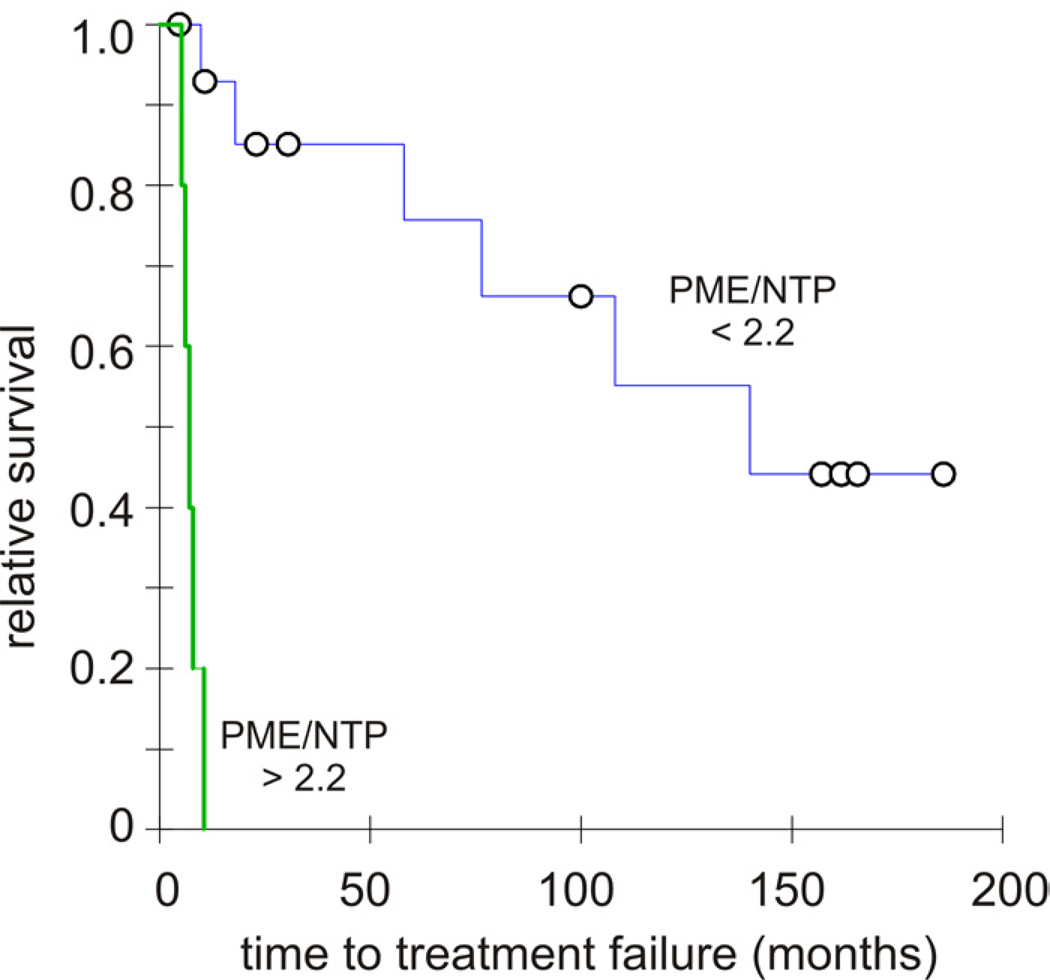
FIGURE 2. Kaplan-Meier curves modeling the Time to Treatment Failure (TTF) of DLBCL patients segregated by the pretreatment PME/NTP tumor value obtained noninvasively by 31P MR spectroscopy.
Survival curves of the DLBCL patients set apart by the PME/NTP cutoff that maximized the comparative relative risk to fail treatment (cutoff at 2.2). The blue survival curve belongs to the group below the cutoff while the green survival curve belongs to the group above it with circles corresponding to censor points in both curves. The statistical difference of the survival function curves determined by the Tarone-Ware was highly significant (p < 0.00001) with a comparative relative risk to fail treatment of 8.66.

