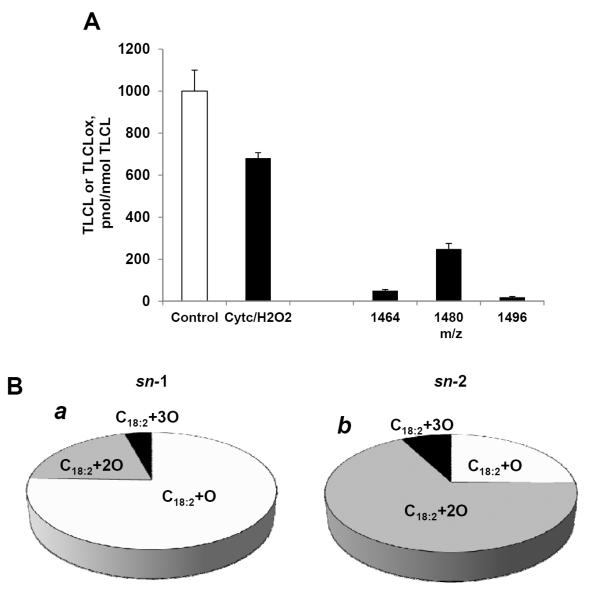
Figure 7. Cyt c induced oxidation of TLCL in the presence of H2O2.
Quantitative LC/MS assessment of TLCL and its oxygenated species (A) formed in cyt c driven reaction. Oxygenated products of C18:2 (B) formed in sn-1 (a) and sn-2 (b) positions of CL upon treatment of TLCL with cyt c/H2O2. After incubation with cyt c/H2O2, TLCL was treated either with PLA1 or PLA2. Liberated oxygenated and non-oxygenated C18:2 were analyzed by reverse phase LC/MS. Data are means ± S.E., n=5, *p<0.05 vs control.

