. 2013 Apr 15;2(Spec Iss):S0011. doi: 10.5702/massspectrometry.S0011

Fig. 1. Normalized spectra for the 2+ and 3+ ions of the Syntide 2 peptide, measured using the “standard” t=0.2 s (black lines) and “extended” t=0.5 s (colored lines) with DV=5.4 kV and 1 : 1 He/N2 gas.19) The peak widths (fwhm, V/cm) are marked with the resolving power values underneath.
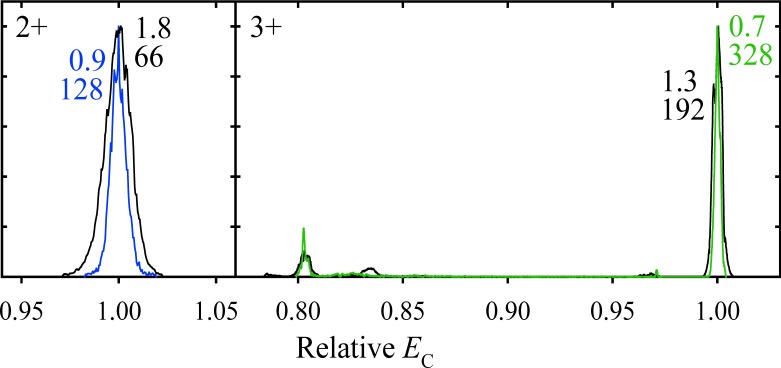
Fig. 1. Normalized spectra for the 2+ and 3+ ions of the Syntide 2 peptide, measured using the “standard” t=0.2 s (black lines) and “extended” t=0.5 s (colored lines) with DV=5.4 kV and 1 : 1 He/N2 gas.19) The peak widths (fwhm, V/cm) are marked with the resolving power values underneath.