. 2013 Apr 15;2(Spec Iss):S0011. doi: 10.5702/massspectrometry.S0011

Fig. 7. Separation of 1+ ions for the 1 : 1 mixture of 16 : 0 (sn1)/12 : 0 (sn2) and 16 : 0 (sn1)/12 : 0 (sn3) regioisomers of diacylglycerol, using DV=4 kV, He/N2 mixtures with He fractions as marked (solid lines), and t=0.2 s.9) The resolving power values for the major peak are underlined. Values below are the distances between two peaks with their resolution (r, the peak distance divided by the average fwhm peak width) underneath. Spectra for each isomer at 50% He are shown in dashed lines.
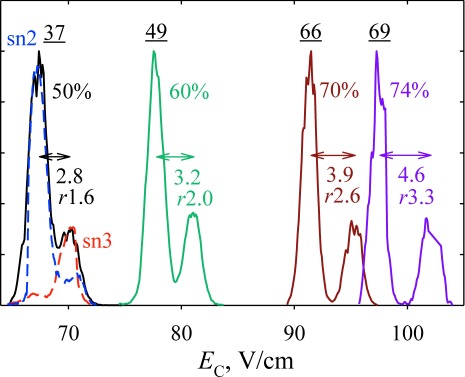
Fig. 7. Separation of 1+ ions for the 1 : 1 mixture of 16 : 0 (sn1)/12 : 0 (sn2) and 16 : 0 (sn1)/12 : 0 (sn3) regioisomers of diacylglycerol, using DV=4 kV, He/N2 mixtures with He fractions as marked (solid lines), and t=0.2 s.9) The resolving power values for the major peak are underlined. Values below are the distances between two peaks with their resolution (r, the peak distance divided by the average fwhm peak width) underneath. Spectra for each isomer at 50% He are shown in dashed lines.