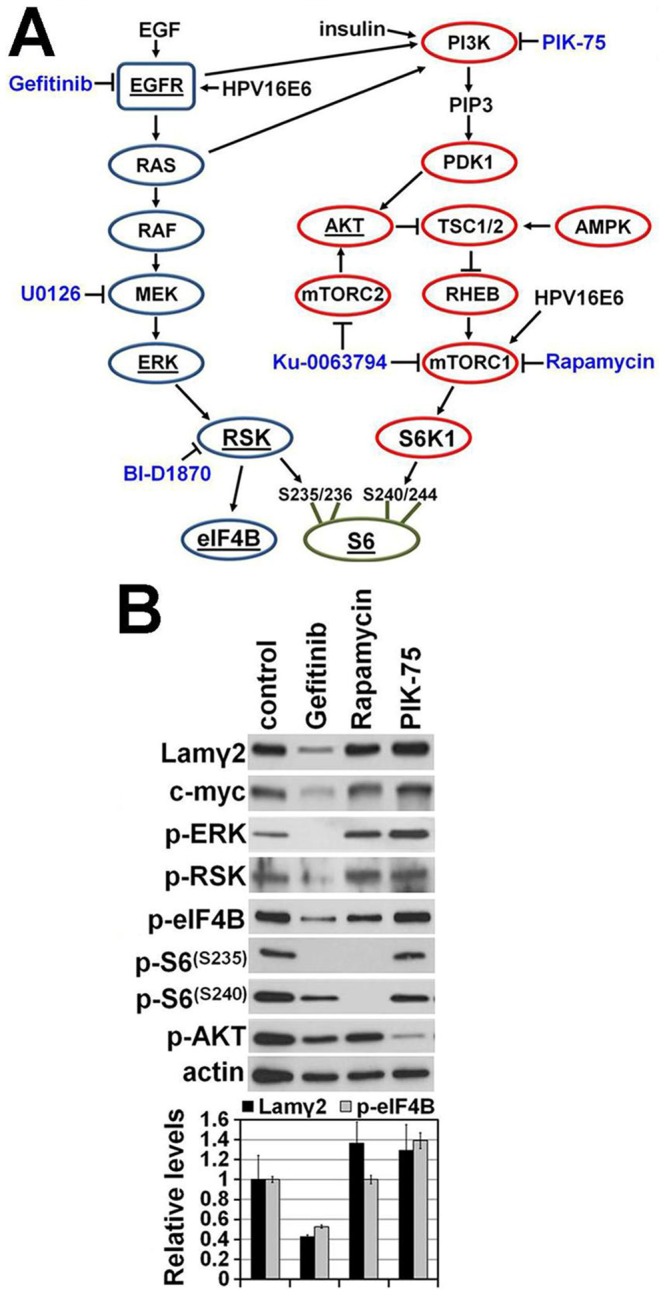
Figure 1. Effects of inhibiting MAPK vs. PI3K/mTOR pathway kinases on Lamγ2 and MYC expression.

A) Elements of the EGFR/RAS/RAF/MEK/RSK (blue) and PI3K/AKT/mTOR (red) kinase cascade signaling pathways and their downstream targets eIF4B and S6. Arrows indicate that the upstream protein activates the downstream target, whereas lines terminating in a crossbar indicate that the upstream protein inhibits the downstream target. Kinase inhibitors are in blue font. Proteins examined for their phosphorylation states by Western blotting are underlined. B) Western blot of confluent cultures of SCC-68 treated for 24 hr with the EGFR kinase inhibitor gefitinib, the mTORC1 inhibitor rapamycin, or the PI3 kinase p110α-specific inhibitor PIK-75. Densitometric analysis of the Lamγ2 (black bars) and p-eIF4B (gray bars) bands of each lane is shown in the bar graph below the blot. Lamγ2 and p-eIF4B levels were normalized to the actin level in each lane and then levels of Lamγ2 and p-eIF4B in inhibitor-treated cultures were expressed relative to those in the untreated control culture.
