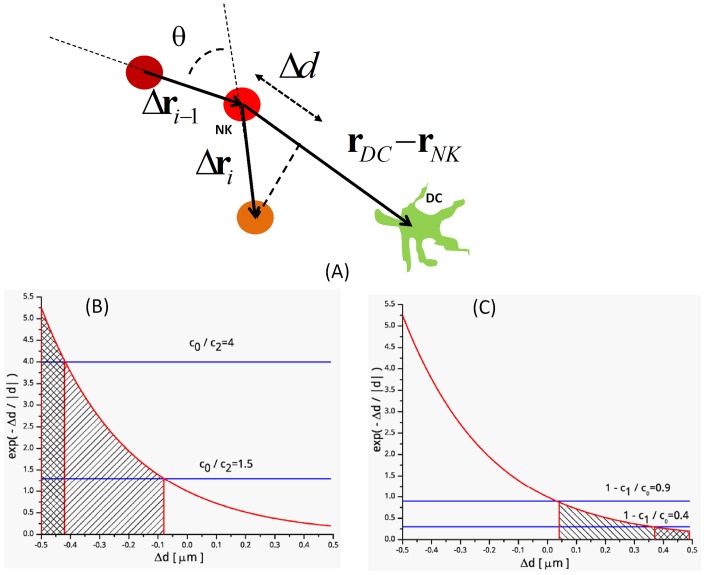
Figure 3. Sketch of the NK cell motion.
The NK cell is sketched as a red-orange circle: the brightness of the red color codes for increasing simulation time. Panel A:  is the deviation angle sampled to implement for the Worm Like Chain model for the diffusion of the NK cell in the tissue. Monte Carlo algorithm for the cell-cell interactions: definition of the displacement parameter, Δd, used for the Metropolis test for the interaction onset. The symbols in panels B and C are:
  ,
,  and
and  . Panel B reports an example of the interaction_start test. The root mean square displacement is
  . Depicted are two cases corresponding to
  and
and  . In the first case Eq. 17 is satisfied even if
  , in the second case Eq. 17 is satisfied only if
  . Panel C reports an example of the interaction_stop test. In this case when
  Eq.18 is satisfied even if
  while when
  Eq.18 is satisfied only if
  .
.

