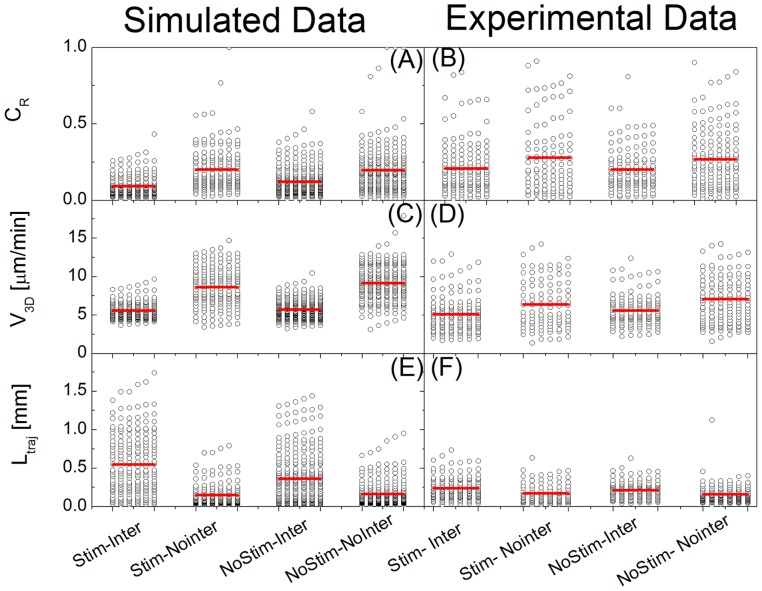
Figure 9. Result of the analysis of the simulated and experimental trajectories of NK cells.
The simulated trajectories were obtained by assuming  and were rebinned to reproduce the experimental time acquisition step (25′), as detailed in File S1 (paragraph S4:“Analysis of dendritic and NK cell interactions”). The NK cell confinement ratio (CR), the 3D speed (v3D) and the trajectory length (Ltraj) computed on more than 200 trajectories (NK cells) are reported in Panels A, B (confinement ratio), C, D (speed) and E, F (trajectory length). In each panel the labels “stimulated” and “un-stimulated” indicate the cases under stimulus (lipopolysaccharide injected i.v. in the mouse for the experimental data and
  for the simulated data) and under no stimulus (no lipopolysaccharide injected i.v. in the mouse for the experimental data and
  for the simulated data). Interacting and non-interacting NK cells were determined in the experimental and simulated data by the instantaneous NK cell velocity and the NK – dendritic cell distance, as described in the text. The horizontal bars indicate on each data set the average value.

