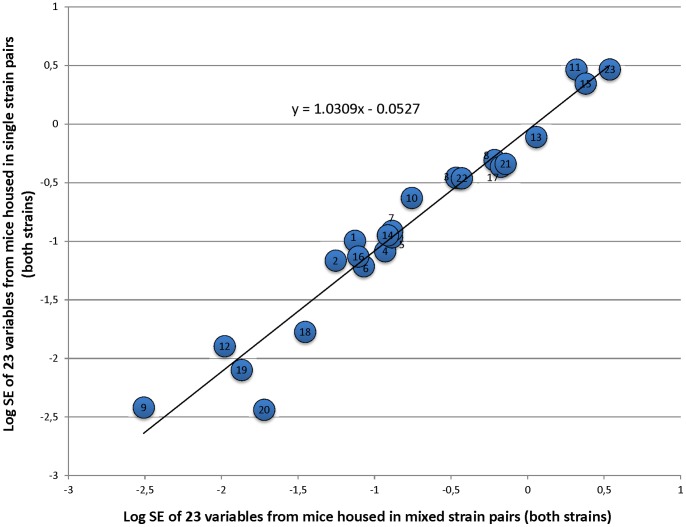
Figure 1. Relationship of the standard errors of 23 dependent variables between single- and mixed-strain housing.
Each point represents the standard errors of one dependent variable labeled as follows: 1) Novel Object 2) Sucrose Consumption 3) Body Weight 4) Startle Response 5) Inactivity 6) Normal Activity 7) Stereotypy 8) Blood Glucose 9) Spleen Weight 10) Red Blood Cell Count 11) Haemoglobin 12) Hematocrit 13) Faecal Corticosterone Metabolites 14) Red Blood Cell Distribution Width 15) Mean Platelet Volume 16) Absolute Neutrophils 17) Absolute Lymphocytes 18) Absolute Monocytes 19) Absolute Eosinophils 20) Absolute Basophils 21) White Blood Cell Count 22) Mean Corpuscular Volume 23) Mean Corpuscular Haemoglobin Concentration. Data shown here have been log transformed (as analysed) to best show the linear relationship.

