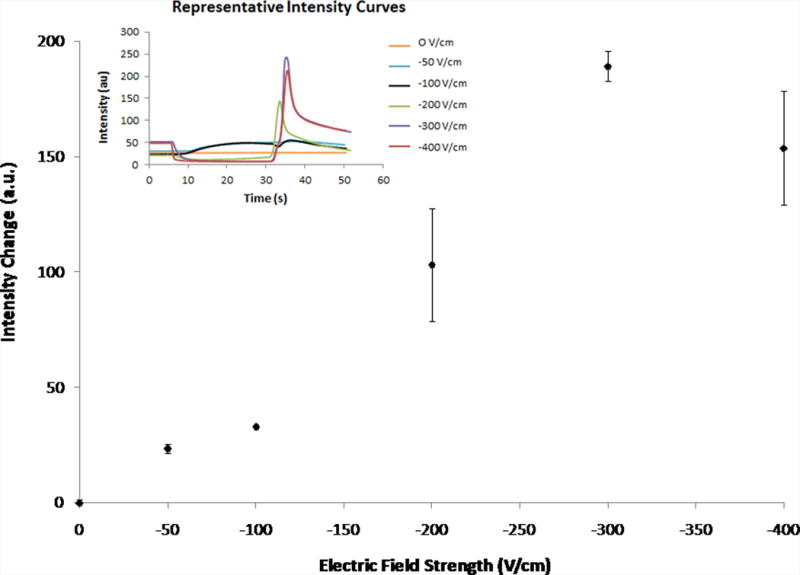
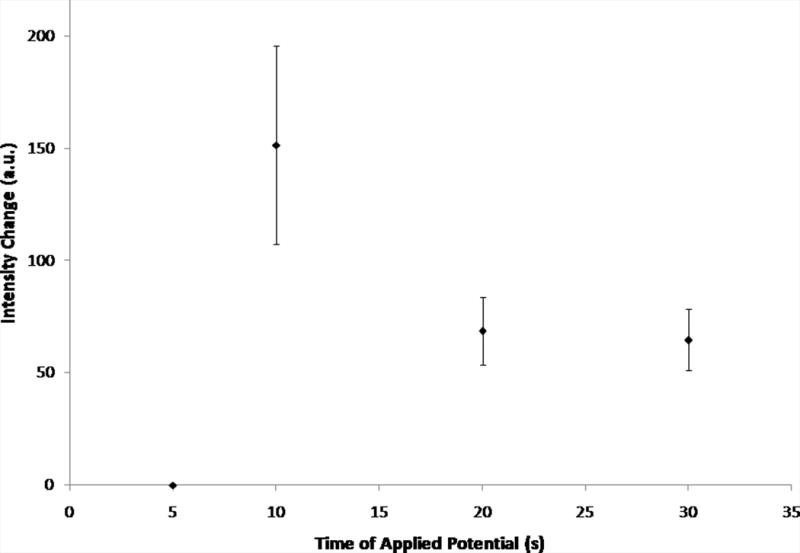
Figure 4.


Change in intensity values for varying electric fields strengths (30 s) and various times of applied potential (−200 V/cm) as measured in-channel. Error bars represent standard deviation. Fig. 4A shows the average intensity changes for varying electric field strengths (0 V/cm – −400 V/cm, n = 3). The inset shows representative curves of the raw data. Fig. 4B shows the average intensity changes for various times of applied potential (5 s – 30 s, −200 V/cm, n = 3, exception: t = 5 s, n = 2).
