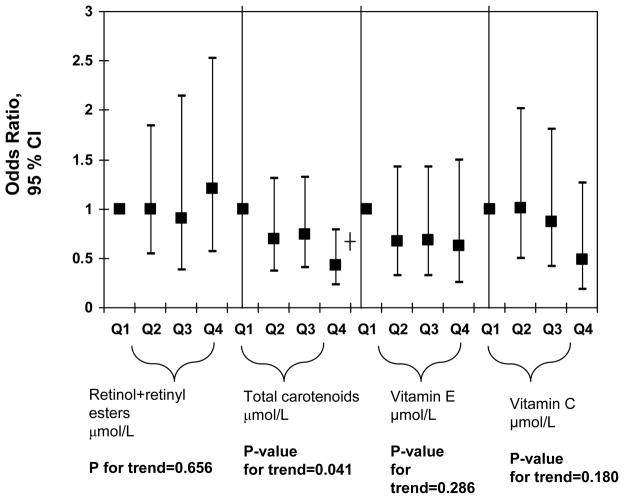
FIGURE 2.
Adjusted odds ratios (with 95% CI) of major serum antioxidant level (expressed as quartiles, Q2, Q3, Q4 vs. Q1) and elevated depressive symptoms among US adults, controlled for dietary antioxidant intakes and supplement use; NHANES 2005–06
Notes: CI=Confidence Interval. Ranges for each antioxidant quartile is as follows in μmol/L: Retinol+retinyl esters (Q1: 0.07–1.7; Q2: 1.7–2.1; Q3: 2.1–2.5; Q4: 2.5–8.9); Total carotenoids (Q1: 0.06–0.86; Q2: 0.86–1.18; Q3: 1.18–1.62; Q4: 1.62–10.1); Vitamin E (Q1: 0.2–26.7; Q2: 21.7–27.3; Q3: 27.4–35.9; Q4: 35.9–303.8); Vitamin C (Q1: 0.6–34.6; Q2: 35.2–54.5; Q3: 55.1–70.4; Q4: 71.0–274.2). Analyses were based on multiple logistic regression models that included all antioxidant exposures simultaneously adjusted for socio-demographic factors: age, sex, race/ethnicity, marital status, educational level and poverty income ratio, and other potential confounders: Lifestyle and health-related factors (smoking status, BMI, physical activity: Mets.hr.wk−1, recoded as “0–<5”; “5–10”; “>10”, history of selected chronic conditions (i.e. type 2 diabetes, CVD and cancer)) and dietary intakes (total energy intake, alcohol, dietary antioxidant (or group of antioxidants), n-3 PUFA, dietary supplement use), serum levels folate, total homocysteine, vitamin B-12, 25-hydroxyvitamin D and serum total cholesterol, anti-depressant use, and the inverse mills ratio, 2-stage Heckman selection model.
*P<0.05 ┼P<0.001 for null hypothesis that Loge(OR)=0.

