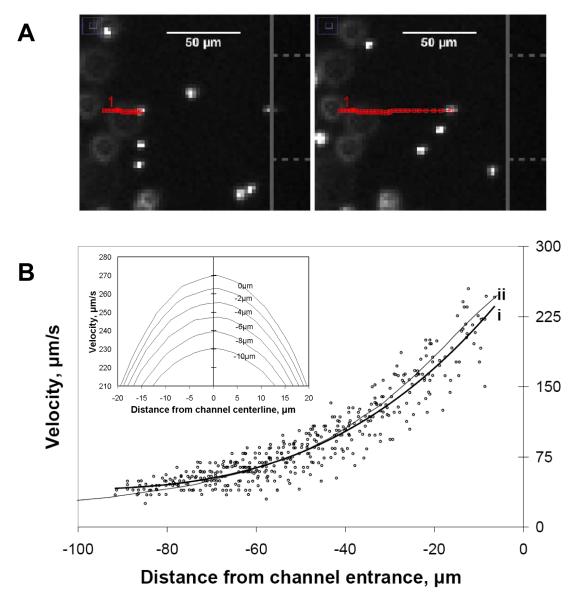
Figure 4.
(A) Representative snapshot of manually tracked fluorescent particle moving left to right and approaching channel entrance along centerline. Open (red) squares represent particle location in prior frames. Capillary face and channel are represented by solid vertical line and dashed horizontal lines, respectively, along right edge of panel. The elapsed time between the two snapshots was 0.88 s. (B) Centerline velocity plot of fluorescent particles as they approached the capillary entrance (x = 0) as in A. Line (i) is the best fit for the data points, and line (ii) is the centerline fluid velocity plot from the 3D model. (B - inset). Simulated velocity profiles about the centerline from 0 to −10 um that illustrate velocity variation off the centerline near the channel entrance (applied U = 0.68 nL/s).

