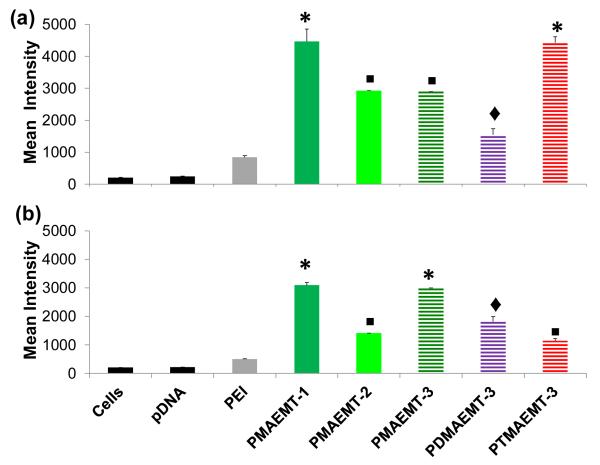
Figure 4.
Mean Cy5 intensity of HepG2 cells. Cells transfected with polyplexes were formed at an N/P ratio of 15 with Cy5-labeled pDNA and the P(MAG-b-methacrylate) structure containing the charge blocks PMAEMT-1,-2, and -3, PDMAEMT-3, and PTMAEMT-3 in (a) serum free Opti-MEM and (b) DMEM containing 10% serum. Error bars are representative of the standard deviation of analyzed data from three replicates. All measurements were found to be statically significant (p<0.05) as compared to cells only and pDNA are marked with an asterisk, a square, or a diamond. Measurements that share the same symbol are not significant different (p<0.05) from each other.

