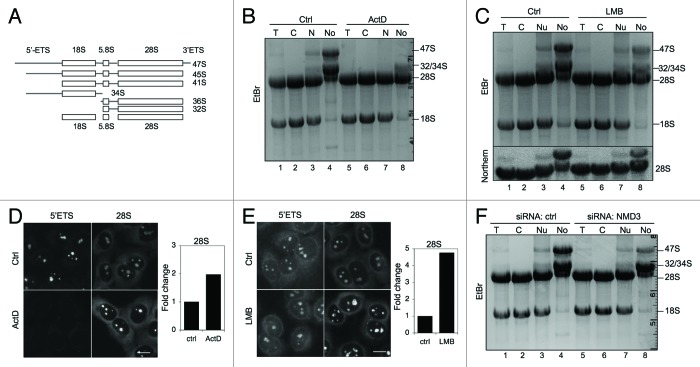
Figure 6. Alterations in nucleolar rRNAs following ActD and LMB treatments and NMD3 silencing. (A) Schematic presentation of rRNA processing. (B) RNA gel analysis of total RNA of cellular fractions treated with ActD (50 ng/ml) for 3 h. RNA was extracted from the samples in Figure 1G. EtBr staining. The migration of rRNAs is indicated to the right. (C) Cells were treated with LMB (20 ng/ml) for 12 h followed by cellular fractionation and isolation of RNA. The RNA gel was stained with EtBr (top panel). Subsequently, the RNA agarose gel was hybridized to digoxigenin-labeled 28S LNA probe (Northern, bottom panel). RNA was extracted from the samples in Figure 3C. (D) Cells were treated with ActD followed by in situ hybridization using probes detecting 5′ETS and 28S rRNAs. Quantification of the image analysis (right panel). Scale bar, 10 µm. (E) Cells were treated with LMB followed by in situ hybridization using probes detecting 5′ETS and 28S rRNA. Quantification of the image analysis (right panel). Scale bar, 10 µm. (F) RNA gel analysis of total RNA of cellular fractions from cells transfected with control or NMD3 siRNAs. EtBr staining.

An official website of the United States government
Here's how you know
Official websites use .gov
A
.gov website belongs to an official
government organization in the United States.
Secure .gov websites use HTTPS
A lock (
) or https:// means you've safely
connected to the .gov website. Share sensitive
information only on official, secure websites.
