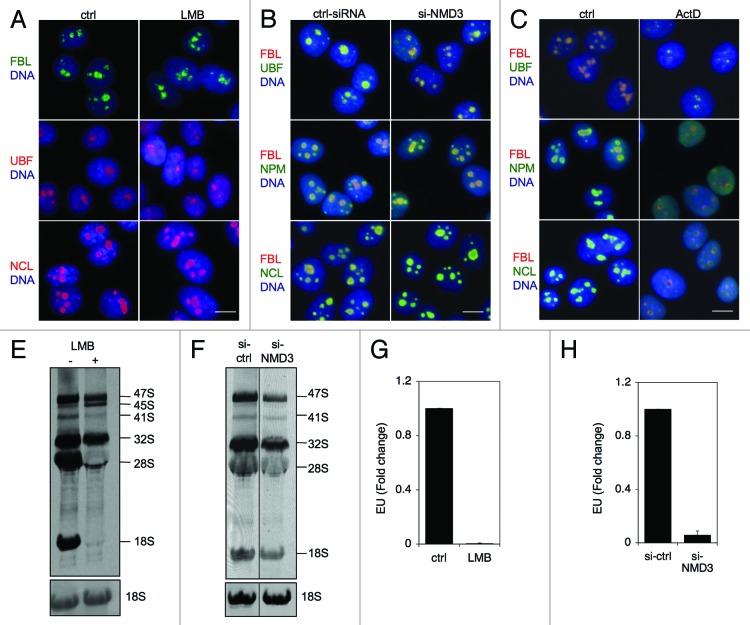
Figure 7. Inhibition of CRM1 and NMD3 affects rRNA synthesis. (A, B and C) Immunofluorescence analysis of the indicated nucleolar proteins following treatment of cells with LMB for 14 h (A), NMD3 silencing (B) or treatment of the cells with ActD for 3 h (C). Scale bars, 10 µm. (D) Cells were treated with LMB for 4 h and labeled for the last two hours with 3H-uridine. RNA was isolated and separated by agarose gel electrophoresis. Autoradiogram is shown. (E) Cells were transfected with or without NMD3 silencing siRNAs and metabolic labeling of rRNA was conducted as in (D). Position of rRNAs are indicated. Total 18S rRNA as stained by EtBr is shown at the bottom. (F and G) Cells were treated with LMB for 13 h as in (D) or NMD3 was silenced as in (E) and cells were incubated for the last hour with EU. EU incorporation was detected, cells were imaged and nucleolar EU signals were quantified of over 200 cells in each assay. n = 2. Error bars, SD. Data represents means ± SD, n = 2 experiments.

An official website of the United States government
Here's how you know
Official websites use .gov
A
.gov website belongs to an official
government organization in the United States.
Secure .gov websites use HTTPS
A lock (
) or https:// means you've safely
connected to the .gov website. Share sensitive
information only on official, secure websites.
