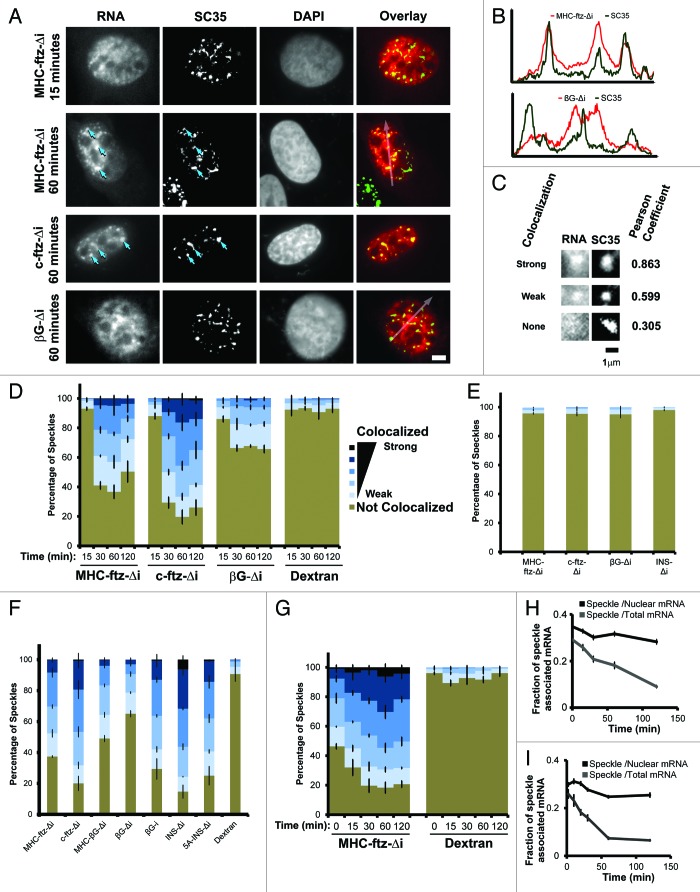
Figure 1. Analysis of mRNA localization to nuclear speckles. (A) U2OS cells were microinjected with plasmids containing the MHC-ftz-Δi, c-ftz-Δi or βG-Δi constructs. After allowing expression for the indicated time points, the cells were fixed, probed for ftz or βG mRNA by FISH, immunostained for the nuclear speckle marker SC35 and stained for DNA using DAPI. Each row represents a single field of view. An overlay of the mRNA (red) and SC35 (green) is shown in the right panels. Scale bar = 5 μm. (B) The fluorescence intensities (y-axis) of mRNA (MHC-ftz-Δi top panel and βG-Δi, lower panel; red) and SC35 (green) were plotted along the length of the arrows (x-axis) as seen in the overlay images in (A). (C) Representative examples of strong, weak and non-colocalization of mRNA and SC35. Again each row represents a single field of view. The Pearson correlation coefficient for each pair of images is shown on the right. Scale bar of 1 µm is shown. (D) U2OS cells were microinjected with various plasmids. After allowing expression for the indicated time points, the cells were fixed, probed and imaged as in (A). For each time point, the percentage of SC35-positive nuclear speckles that colocalized with MHC-ftz-Δi, c-ftz-Δi and βG-Δi mRNAs, was plotted. As a control, the percentage of speckles showing different levels of colocalization with the microinjection marker, 70 kDa Dextran conjugated to Oregon Green was also analyzed. Speckles were binned into 6 categories based on their Pearson correlation coefficient (“Strong colocalization,” R > 0.9; R = 0.9‒0.8; R = 0.8‒0.7; R = 0.7‒0.6; “Weak colocalization,” R = 0.6‒0.5; “Not colocalized” R < 0.5). Each column represents the average of three experiments, each consisting of 100 SC35-positive speckles (see methods section for more details). Error bars represent standard error of the mean. (E) For each mRNA, FISH images from one set of nuclei (1 h post-microinjection), were superimposed over SC35 images from a separate set of un-injected nuclei to determine the rate of random colocalization. The data was analyzed and plotted as in (D). (F) The percentage of speckles that colocalized with different transcripts was plotted for cells, 1 h after microinjection of plasmids. Again, the data was analyzed and plotted as in (D). (G and H) Plasmids containing the MHC-ftz-Δi gene were microinjected into the nuclei of U2OS cells and mRNA was allowed to express for 20 min. Cells were then treated with α-amanitin and the colocalization of MHC-ftz-Δi mRNA with SC35 over time (post-drug treatment, indicated on the x-axes) was monitored. (G) The percentage of nuclear speckles that demonstrate different levels of colocalization with MHC-ftz-Δi. Again, the data was analyzed and plotted as in (D). (H) The amount of MHC-ftz-Δi mRNA that is present in nuclear speckles (as defined by the brightest 20% pixels in the nucleus, using SC35 immunofluorescence) as a percentage of either the cellular or nuclear level. Each data point represents the average and standard error of the mean of 10 cells. (I) In vitro transcribed MHC-ftz-Δi mRNA was microinjected into the nuclei of U2OS cells. Cells were left for various amounts of time to allow mRNA export. The amount of MHC-ftz-Δi mRNA present in nuclear speckles was monitored as described in Figure 1H.

An official website of the United States government
Here's how you know
Official websites use .gov
A
.gov website belongs to an official
government organization in the United States.
Secure .gov websites use HTTPS
A lock (
) or https:// means you've safely
connected to the .gov website. Share sensitive
information only on official, secure websites.
