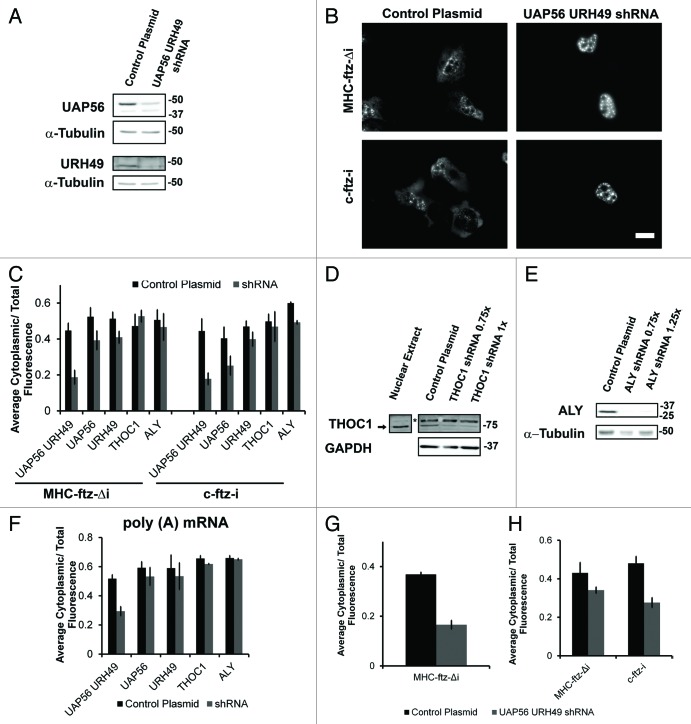
Figure 3. UAP56 and URH49 are required for the export of MHC-ftz-Δi. (A) U2OS cells were treated with lentiviruses that mediate the delivery of either plasmids that contain shRNAs directed against UAP56 and URH49 or an empty control plasmid. Cell lysates were collected after 72 h, separated by SDS-PAGE and analyzed by immunoblotting using antibodies against UAP56, URH49 and α-tubulin. (B and C) U2OS cells depleted of various proteins 72 h (for UAP56 and URH49) or 96 h (for THOC1 or Aly) post-infection were microinjected with plasmids containing MHC-ftz-Δi or c-ftz-i. After allowing expression for 20 min, cells were treated with α-amanitin and allowed to export the mRNA for an additional 2 h. Cells were then fixed, and the mRNA was stained by FISH (B). Scale bar = 20 µm. (C) Quantification of the fraction of MHC-ftz-Δi and c-ftz-i mRNA in the cytoplasm. Each bar represents the average and standard error of at least three independent experiments, each consisting of 15‒30 cells. Note that for each experiment, depleted and control cells were assayed in parallel to control for day-to-day variations in nuclear export levels. (D and E) U2OS cells were treated with lentiviruses that mediate the delivery of shRNAs directed against THOC1 (D), Aly (E) or an empty plasmid (D and E). Cell lysates were collected after 96 h, separated by SDS-PAGE and analyzed by immunoblotting with antibodies against THOC1, Aly, GAPDH and tubulin. Asterisk represents a nonspecific band that is absent from HeLa nuclear extract. To account for unequal cell confluency several volumes of the knock-down lysate were loaded (0.75 × , 1 × , or 1.25 × of the control cell lysate). (F) Quantification of the fraction of poly(A) mRNA in the cytoplasm in cells co-depleted of UAP56 and URH49, or depleted of UAP56, URH49, THOC1 or Aly, or treated with control lentiviruses. Each bar represents the average and standard error of at least three independent experiments, each consisting of 15‒30 cells. (G) U2OS cells co-depleted of UAP56 and URH49, or treated with control lentiviruses, were microinjected with DNA plasmids containing MHC-ftz-Δi. Cells were fixed two hours after injection without the prior addition of the transcription inhibitor α-amanitin and the mRNA was stained by FISH. Quantification of the fraction of cytoplasmic mRNA is shown. Each bar represents the average of at least three independent experiments, each consisting of 11‒30 cells. Error bars represent standard error of the mean. (H) U2OS cells co-depleted of UAP56 and URH49, or treated with control lentiviruses, were microinjected with either in vitro transcribed and polyadenylated MHC-ftz-Δi or c-ftz-i mRNA. Cells were fixed 1 h after microinjection and the mRNA was stained by FISH. Quantification of the cytoplasmic mRNA distribution is shown. Each bar represents the average and standard deviation of two independent experiments, each consisting of 9‒25 cells.

An official website of the United States government
Here's how you know
Official websites use .gov
A
.gov website belongs to an official
government organization in the United States.
Secure .gov websites use HTTPS
A lock (
) or https:// means you've safely
connected to the .gov website. Share sensitive
information only on official, secure websites.
