
Fig. 3.
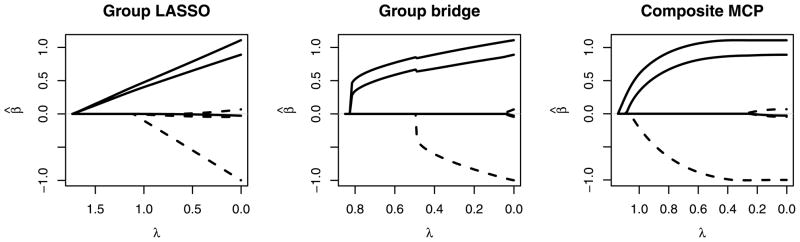
Coefficient paths from 0 to λMAX for group LASSO, 2-norm group MCP, 1-norm group bridge, and composite MCP for a simulated data set featuring two groups, each with three covariates. In the underlying data-generating mechanism, the group represented by solid lines has two covariates with coefficients equal to 1 and the other equal to 0; the group represented by dashed lines has two coefficients equal to 0 and the other equal to −1.