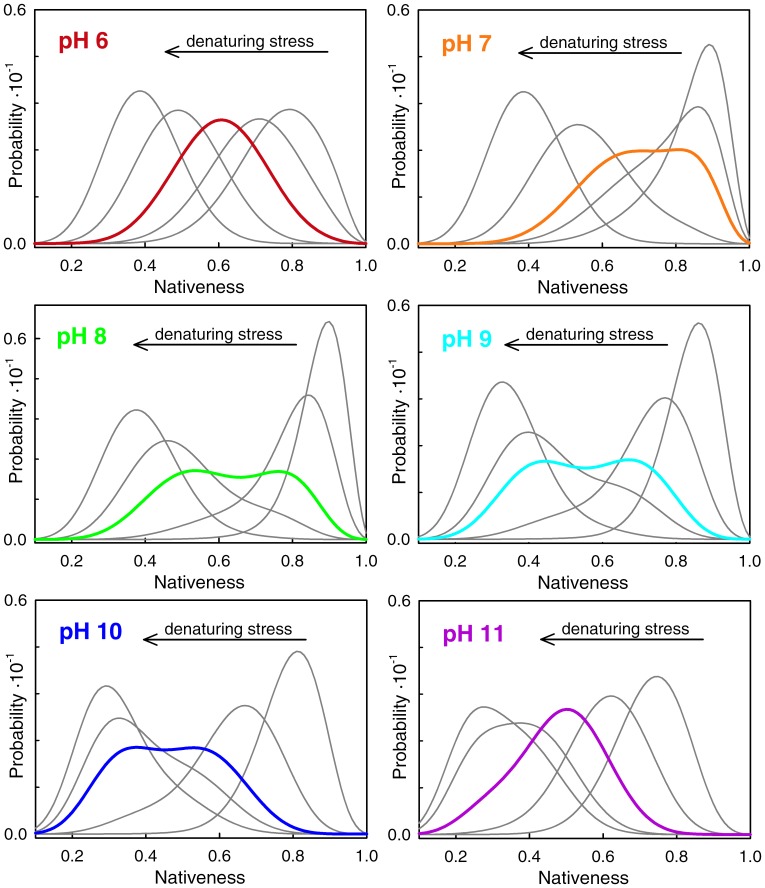
Figure 9. Conformational ensemble of BBL as a function of pH and denaturing stress as predicted by the 1D free energy surface model.
Chemical denaturation was simulated as explained in the Experimental Methods and Theoretical Model section. The panels show the conformational ensembles for five conditions from highly native to highly denaturing at each pH value (color code as before).

