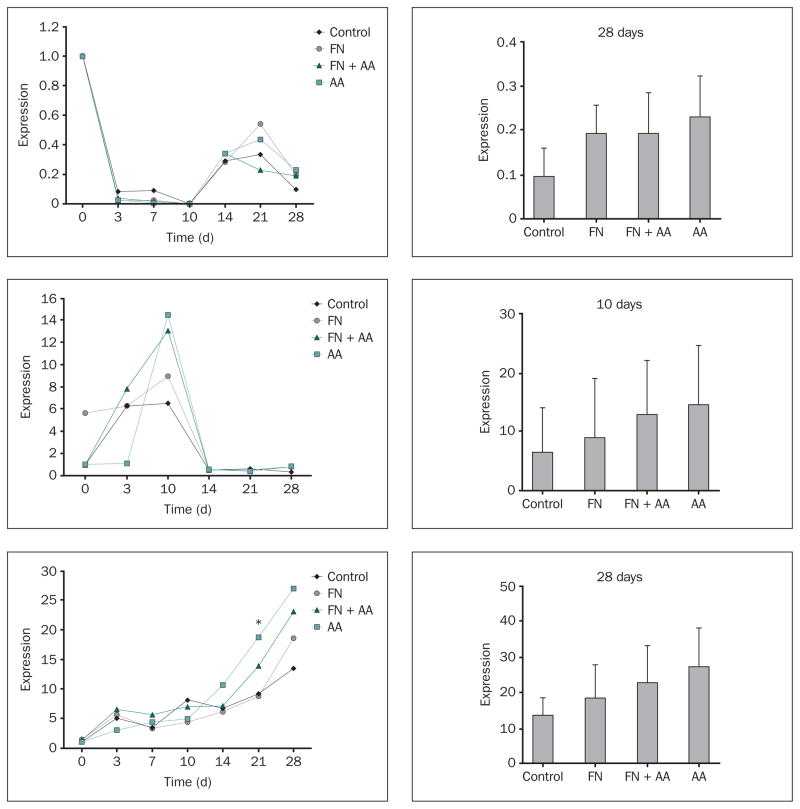
Fig 2.
a to 2c Effects of fibronectin and ascorbic acid on (top to bottom) type 1 collagen (α1), PTH-rp, and ALP gene expression. Changes in mRNA levels over the time of cell culture (relative to day 0 in control samples) were measured by quantitative RT-PCR. Right column: Levels of expression (relative to day 0 in the control) measured on days 28, 10, and 28 for type 1 collagen, PTH-rp, and ALP, respectively; data represent means ± SE. *Significantly greater than control or FN groups at day 21 (P < .05) based on one-way ANOVA.

