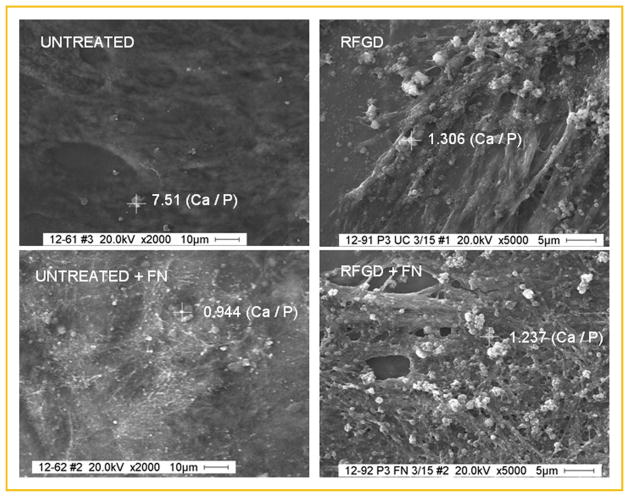
Fig. 2.
Scanning electron micrographs and EDAX analysis of MC3T3 osteoprogenitor cell cultures grown on untreated or RFGD-pretreated Ti6Al4V disks that were uncoated or fibronectin-coated (FN). Cells were plated on disks, incubated with cell culture media containing 50 μg/ml ascorbic acid and 3mM β-glycerophosphate for 3 weeks, fixed in 4% paraformaldehyde, images were captured by SEM and selected particles (marked by crosshairs) that appeared brighter than background were analyzed by EDAX. The calcium: phosphorus mass ratio determined by EDAX analysis of the atomic composition of each selected particle is shown next to the crosshairs overlying that particle. Calcium: phosphorus mass ratios were determined by dividing the AUC (area under the curve) for the calcium elemental scan by the AUC for the phosphorus elemental scan. Images of UNTREATED disks are shown at 2,000× magnification; those of RFGD-PRETREATED DISKS are shown at 5,000× magnification. FN, fibronectin; RFGD, radiofrequency plasma glow discharge pretreatment.

