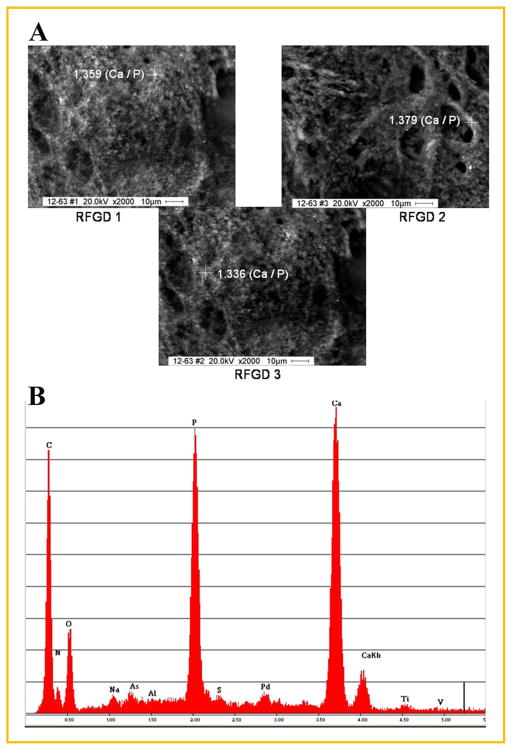
Fig. 4.
SEM and EDAX analysis of mineral formed in MC3T3 osteoprogenitor cell cultures grown on an RFGD-pretreated uncoated Ti6Al4V disk. Cells were cultured on an RFGD-pretreated disk (without fibronectin coating) with cell culture media containing 50 μg/ml ascorbic acid and 3mM β-glycerophosphate for 4 weeks, fixed in 4% paraformaldehyde, images were captured by SEM and selected particles were analyzed by EDAX. A: Particles analyzed by EDAX in three regions of the same disk (RFGD1, RFGD2, and RFGD3) are marked by crosshairs; the Ca:P mass ratio determined by EDAX analysis of the atomic composition of each particle is shown next to the crosshairs overlying that particle. B: The EDAX spectra obtained for the particle analyzed in RFGD3 is shown. Images are shown at 2,000× magnification. RFGD, radiofrequency plasma glow discharge pretreatment.

