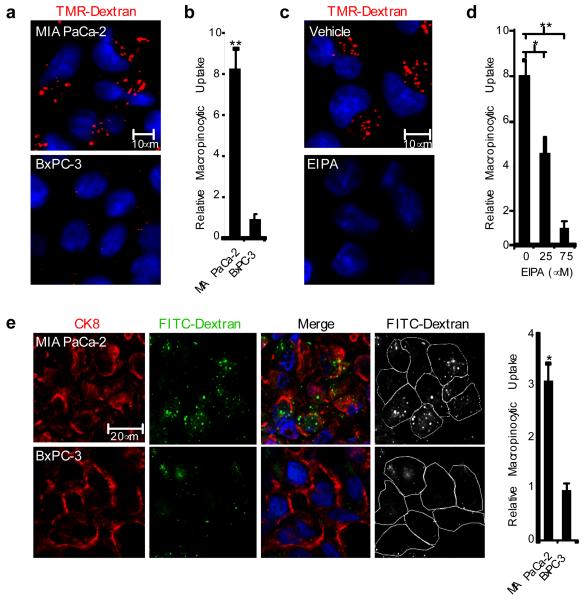
Figure 1. Oncogenic K-Ras-expressing pancreatic cancer cells display elevated levels of macropinocytosis both in culture and in vivo.
a, A macropinocytosis uptake assay utilizing TMR-dextran as a marker of macropinosomes (red) indicates that MIA PaCa-2 cells display elevated levels of macropinocytosis compared to BxPC-3 cells. DAPI staining (blue) identifies nuclei. b, Data are expressed as arbitrary units and are presented relative to the values obtained for BxPC-3 cells. c, Macropinocytic uptake in MIA PaCa-2 cells treated with either vehicle (DMSO) or 75 μM EIPA. d, Quantification of macropinocytic uptake in MIA PaCa-2 cells treated with 0, 25 or 75 μM EIPA. Data are presented relative to the values obtained for the 75 μM condition. e, Visualization and quantification of macropinocytosis in vivo. Representative images from sections of FITC-dextran (green) injected tumor xenografts stained with anti-CK8 (red). Cell boundaries (white outline) were delineated based on the CK8 staining. Data are presented relative to the values obtained for the BxPC-3 tumors. For all graphs, error bars indicate mean +/− SEM for n=3 independent experiments with at least 300 cells scored per experiment. Statistical significance was determined via t-test; *p<0.05, **p<0.01.

