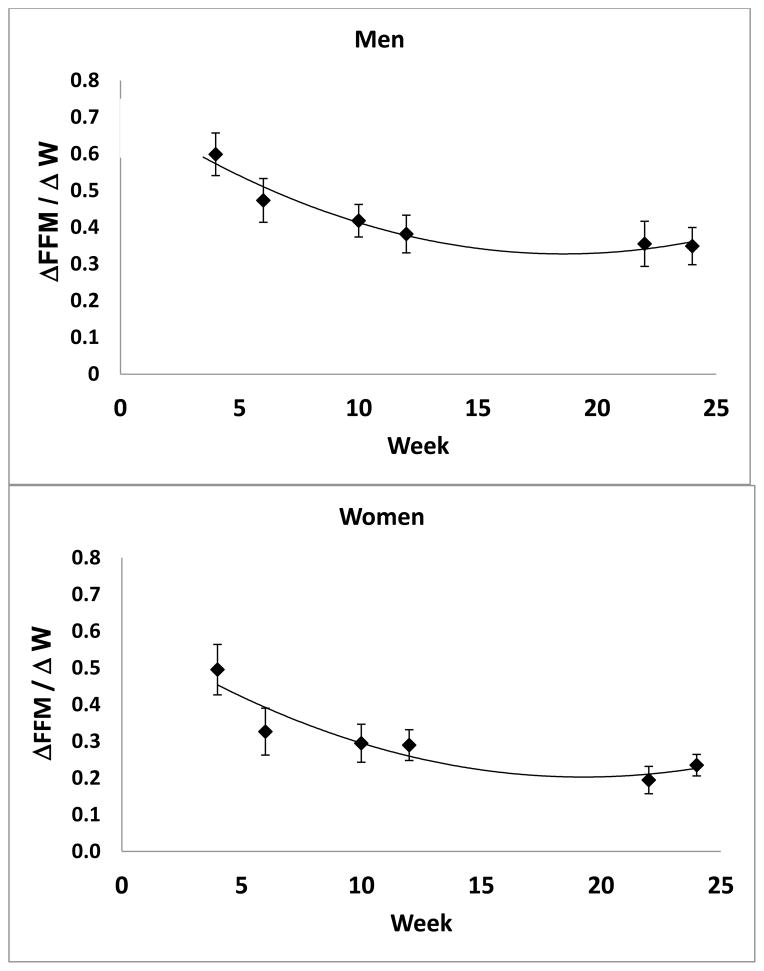
Figure 2.
Fraction of weight loss as fat-free mass (ΔFFM/ΔW, X±SEM) versus study week observed in the CALERIE Study participants. The group mean values are fit with a logarithmic regression model in men (upper panel; energy content of weight change (kcal/kg) = −0.13 × ln(time, in weeks) + 0.73; R2=0.89, p<0.05) and women (lower panel; energy content of weight change (kcal/kg) = −0.14 × ln(time, weeks) + 0.63; R2 = 0.84, p<0.05).

