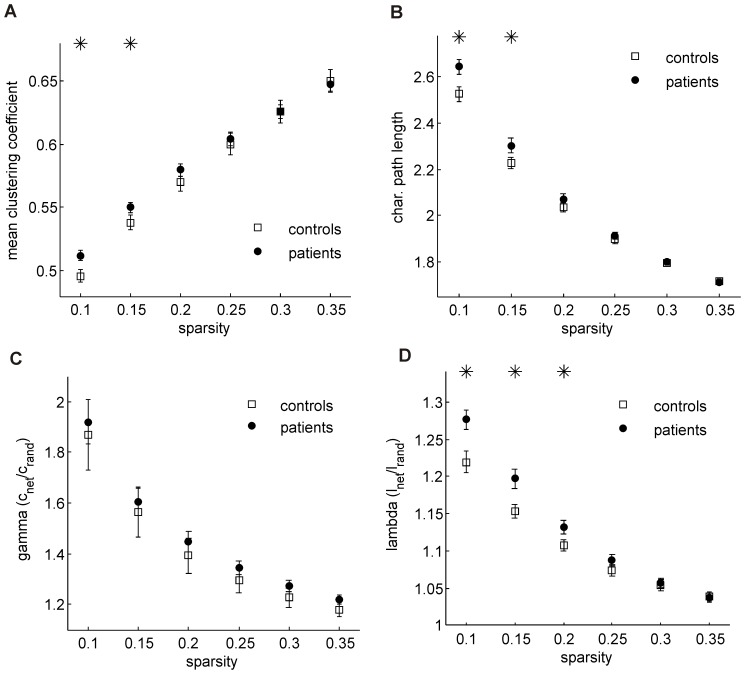
Figure 3. Global network properties for Parkinson’s disease patients (PD, full circles) and healthy controls (squares) as a function of the sparsity.
A) mean clustering coefficient B) characteristic path length C) clustering coefficient normalized to a reference random network D) characteristic path length normalized to a reference random network. The asterisks indicate significant between-group differences (permutation test, α = 0.05).

