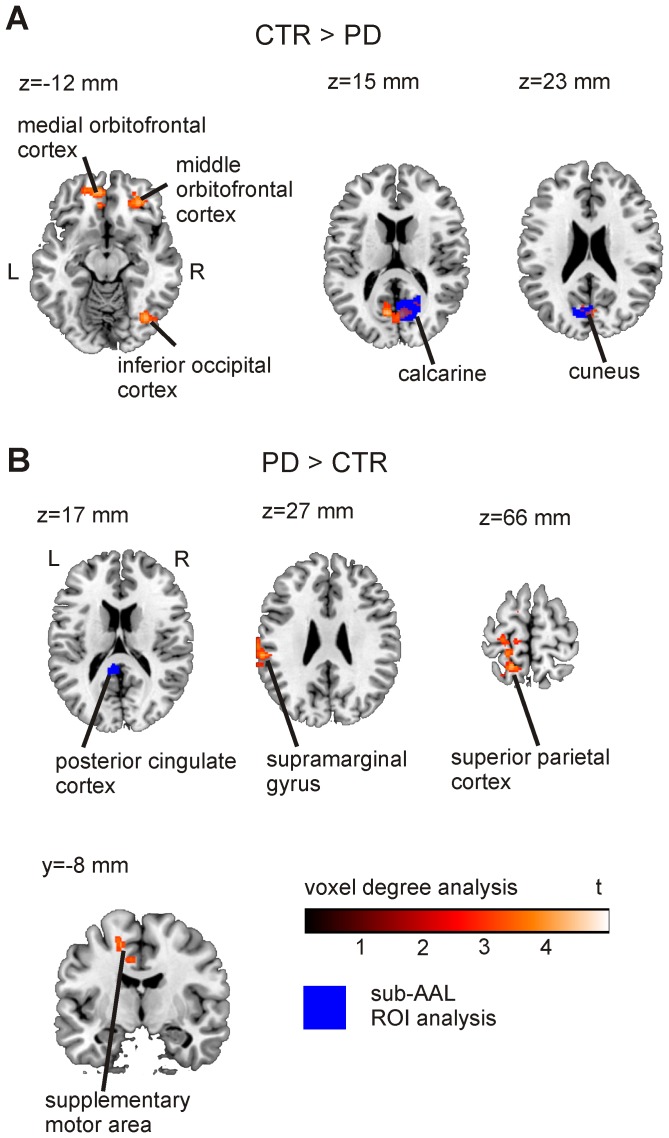
Figure 5. Between group effects in z-degree.
Voxel-level (assessed for cluster-wise significance using a cluster defining threshold of p = 0.005; 0.05 FDR-corrected) and ROI-level data (blue areas; 0.05 FDR corrected; sparsity S = 0.2) are presented. A) Regions with a larger degree in healthy controls compared to patients. B) Regions with a larger degree for PD patients compared to controls.

