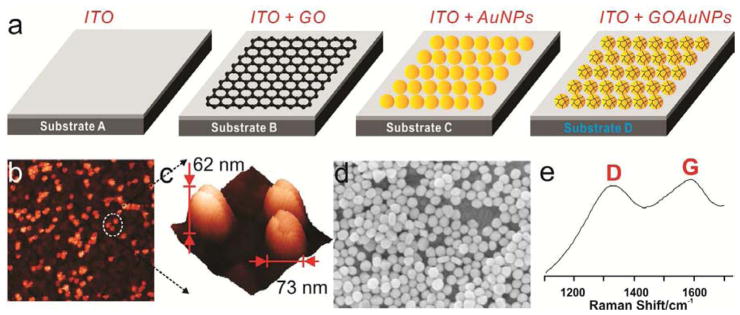
Figure 2.

(a) Schematic diagram representing four different substrates modified with graphene (Substrate B), gold nanoparticles (Substrate C) and GO-encapsulated GNP (Substrate D). (b) AFM images of Substrate D and (c) high resolution AFM image of (b) for the confirmation of GO-encapsulated GNP nanoparticles. The X and Y axis were 3um × 3um and 200nm × 200nm for image (b) and (c), respectively, and the scan rate was 0.5Hz and 0.1Hz for image (b) and (c), respectively. (D) SEM image of Substrate D with a high concentrations of GO-encapsulated GNP. (e) Raman spectra of Substrate D to verify the encapsulation of GO on the surface of the GNPs.
