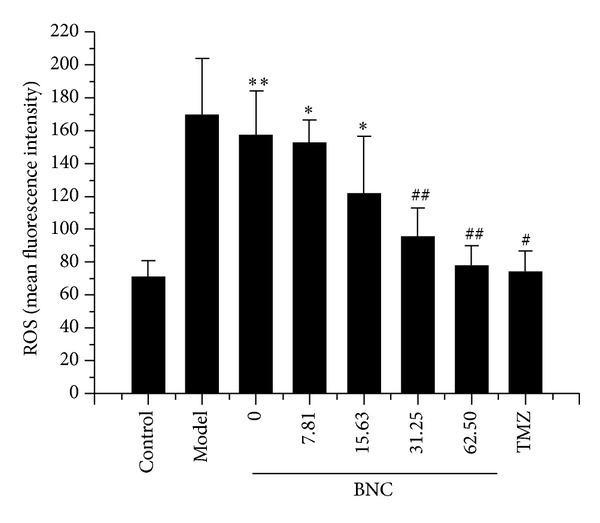
Figure 6.

Protective effects of BNC due to reduced H2O2-induced generation of intracellular ROS measured by the DCFDA assay. Values are expressed as mean ± SD from three independent experiments. **P < 0.01 versus control; *P < 0.05 versus control; ## P < 0.01 versus model; # P < 0.05 versus model.
