
Figure 7.
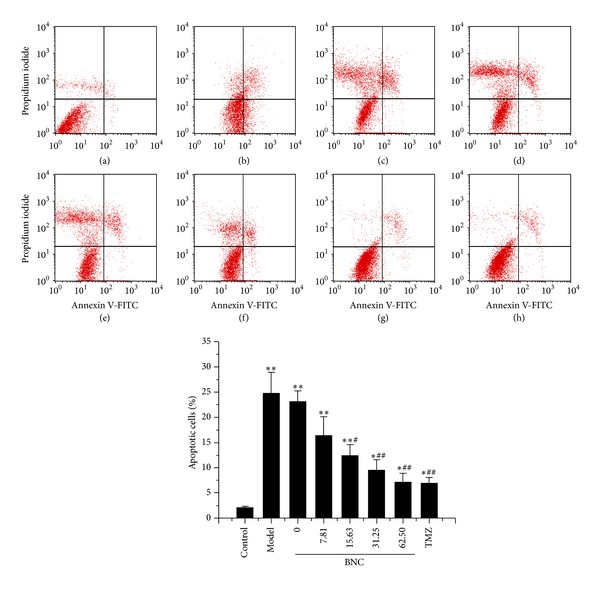
BNC protected H9c2 cells from H2O2-induced apoptosis, as detected by Annexin V-FITC and PI staining with FCM analysis. (a) H9c2 cells without BNC or H2O2 (control); (b) H9c2 cells exposed to 100 μM H2O2 (model); ((c)–(h)) H9c2 cells pretreated with 0, 7.81, 15.63, 31.25, 62.50 μg/mL BNC, or 10 μM TMZ followed by the treatment of 100 μM H2O2. Values are expressed as mean ± SD from three independent experiments. **P < 0.01 versus control; *P < 0.05 versus control; ## P < 0.01 versus model; # P < 0.05 versus model.