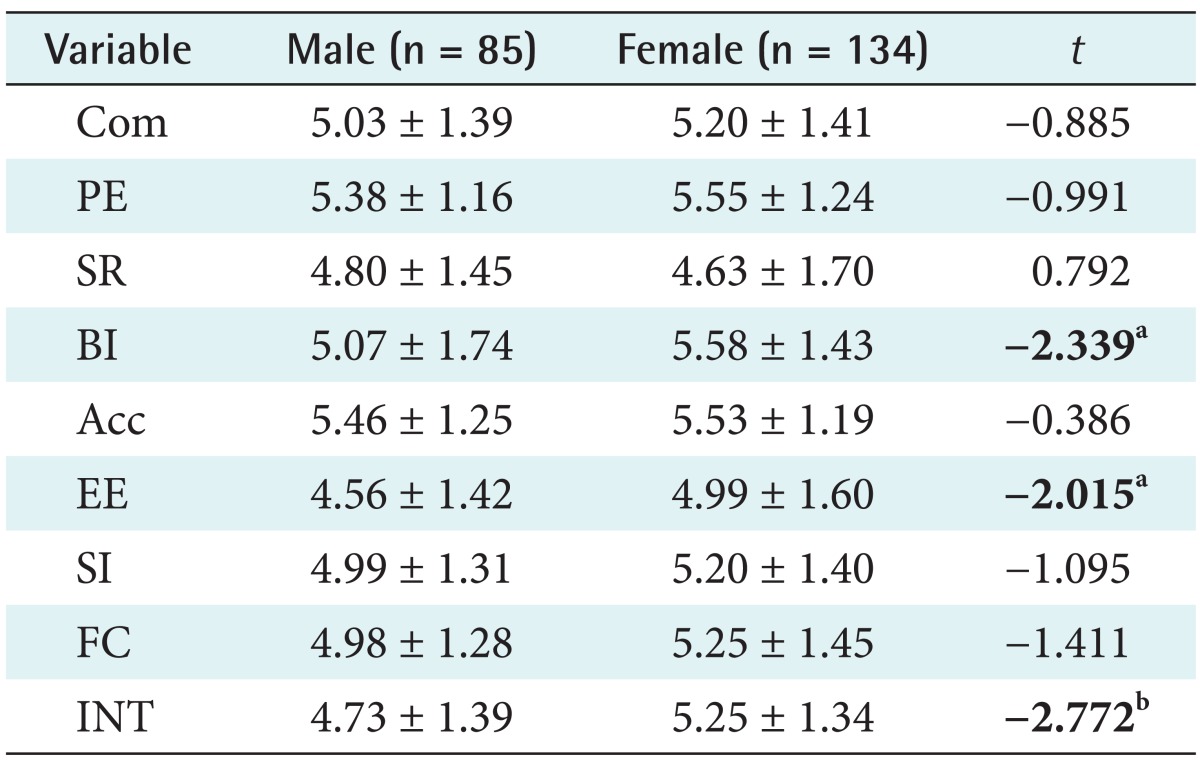
Table 5.
Perceptions differences according to gender

Values are presented as mean ± standard deviation.
Com: communication, PE: performance expectancy, SR: service risk, BI: behavioral intention to use, Acc: accessibility, EE: effort expectancy, SI: social influence, FC: facilitating conditions, INT: intimacy.
at0.05 = 1.960, bt0.01=2.576.
