
Table 1.
Demographic and clinical characteristics of participants (n = 6,500)
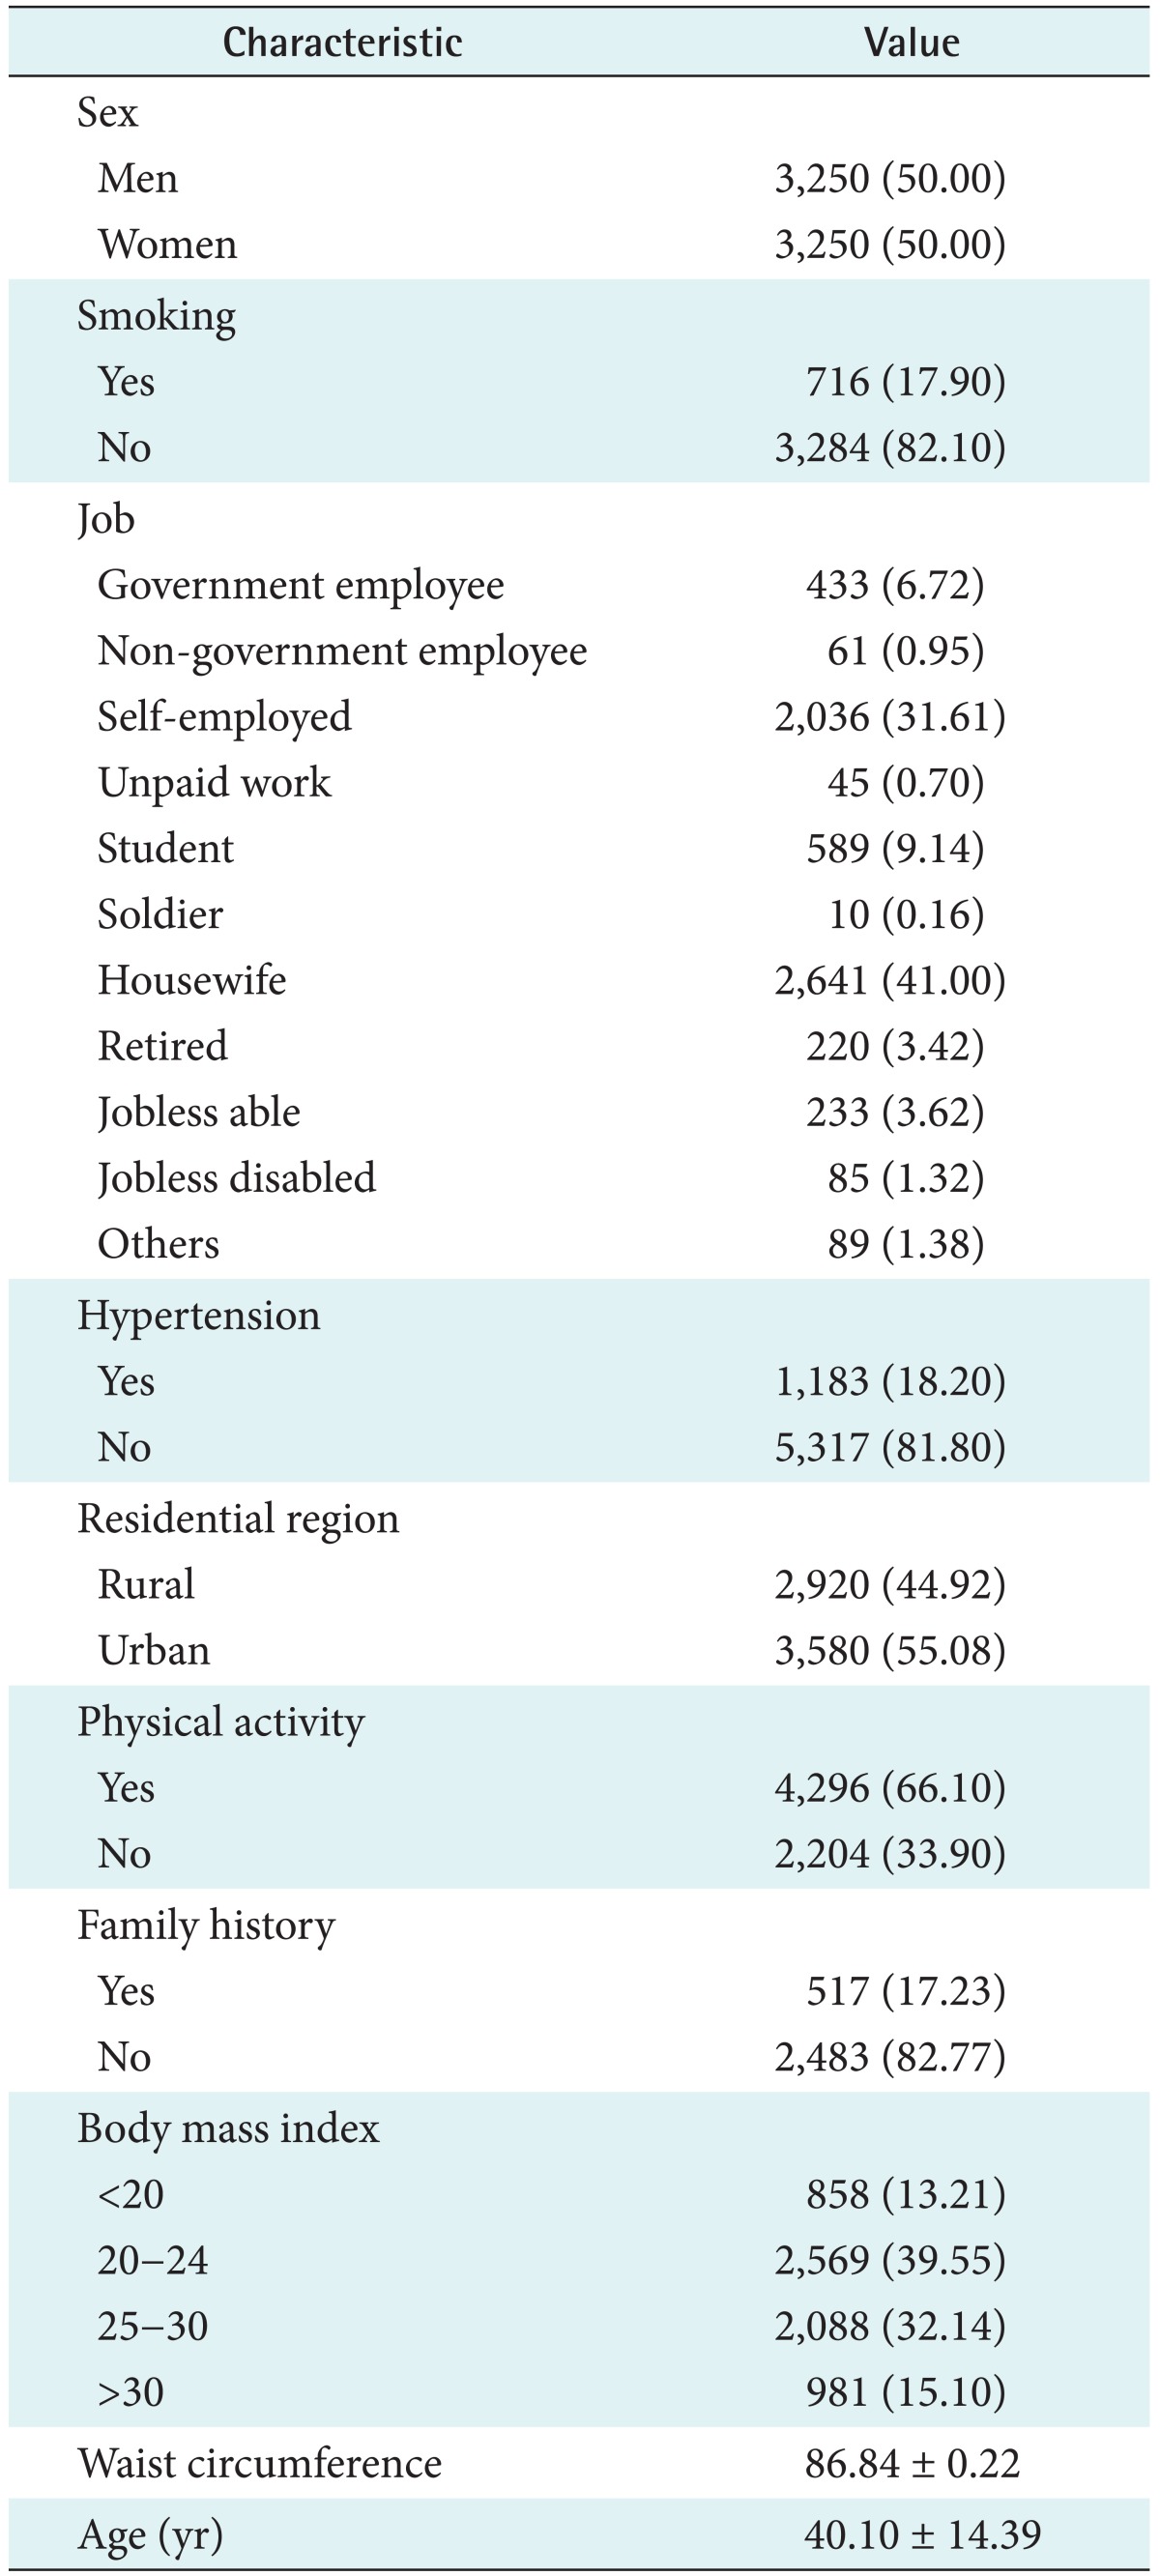
Values are presented as number (%) or mean ± standard deviation.
Official websites use .gov
A
.gov website belongs to an official
government organization in the United States.
Secure .gov websites use HTTPS
A lock (
) or https:// means you've safely
connected to the .gov website. Share sensitive
information only on official, secure websites.
Demographic and clinical characteristics of participants (n = 6,500)
Values are presented as number (%) or mean ± standard deviation.