
Figure 2.
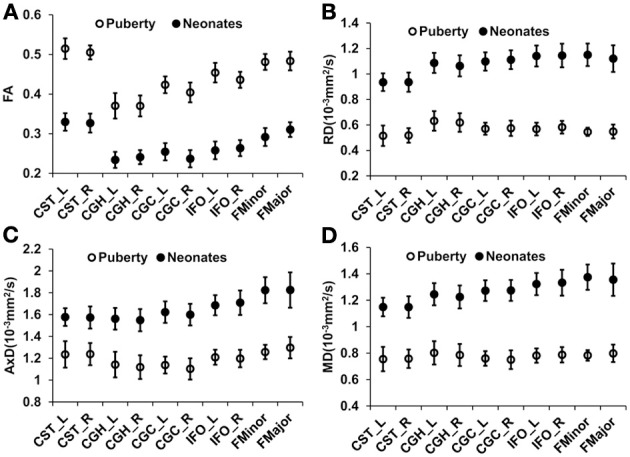
Mean and standard deviation of tract-level FA (A), RD (B), AxD (C), and MD (D) measurements for 26 neonates and 28 children around puberty for all the 10 WM tracts. Error bars indicate standard deviations across all the subjects at the same age group.