
Figure 4.
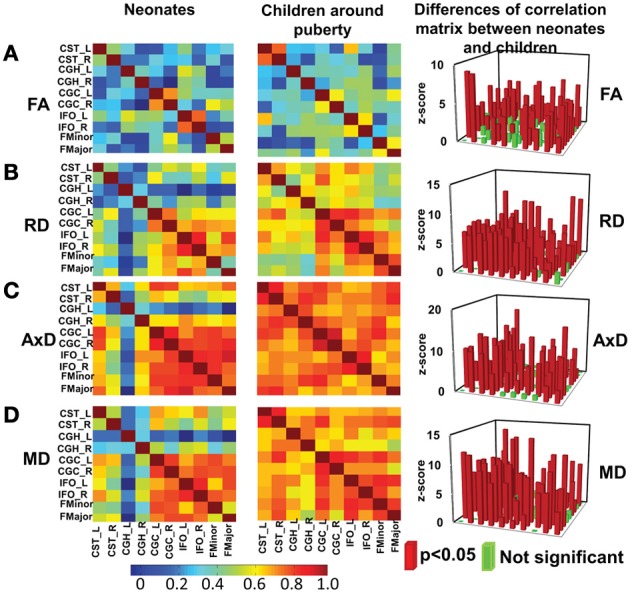
Heat maps of the inter-tract correlation matrices obtained from tract-level FA (A), RD (B), AxD (C) and MD (D) measurements of both age groups. The left and middle panels show the inter-tract correlation matrices for neonates and children around puberty, respectively. The right panel shows the z-scores of the changes in correlation strength between the two age groups. In the z-score plots, the entries with significant (p < 0.05) changes in inter-tract correlation strengths are shown in red color while entries with non-significant (p > 0.05) change in inter-tract correlation strengths are shown in green color. Color bar encoding the correlation strengths in the left and middle columns is also shown.