Figure 2.

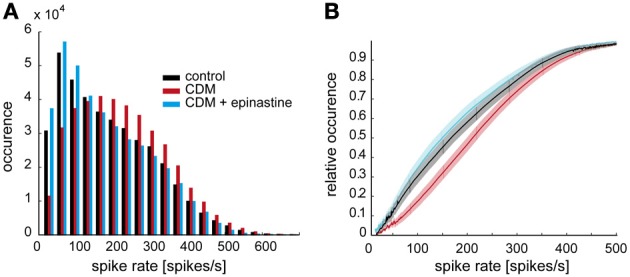
Octopaminergic modulation of stimulus-induced overall spiking activity of V1. (A) Frequency distribution of spike rates in response to naturalistic stimulation in the control condition (black), after CDM administration (red), and after subsequent epinastine administration (blue). (B) Empirical cumulative frequency distributions. The shaded areas around the lines indicate 5% confidence intervals. Same color coding as in A.
