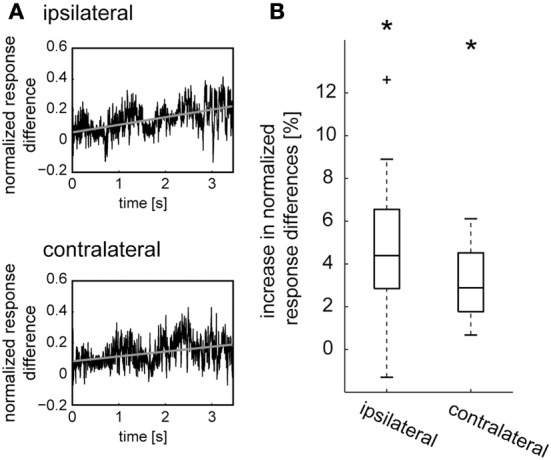
Figure 3.

Development of octopamine-mediated effects over time during sustained naturalistic stimulation. (A) The difference between the responses of the V1 neuron in the states after CDM application and after subsequent epinastine application (see purple lines in Figure 1C) was taken and, for normalization, divided by the sum of the respective spike rates for each time point. The time courses of the normalized response differences obtained for each neuron were averaged and are shown for the ipsilateral and contralateral side (black traces). Linear regressions were calculated for each neuron and averaged (gray lines). (B) Percentage of increase per second in normalized response difference, determined from the slope of the linear regression line. The boxplots show the data of all cells, with the median as a central line, the upper/lower quartiles containing 50% of all data as box edges, and whiskers spanning the data range excluding outlier, which are shown as crosses. The asterisks represent statistical significance at the 5% significance level (Wilcoxon signed rank test, N = 14).
