Figure 7.
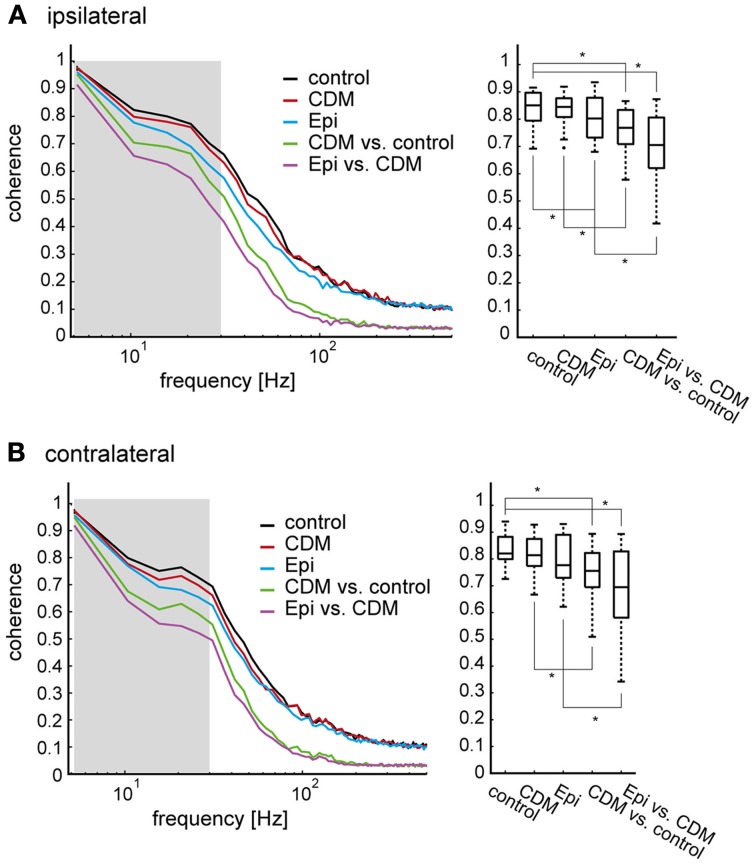
Coherence of responses within and between different states of octopaminergic modulation. (A) left: The coherence as a measure of noise (expected coherence) was determined as the coherence between individual responses and their mean response, all within one and the same condition. All coherence values for the ipsilateral side were first calculated for individual flies, then averaged across all flies (N = 14). The black trace shows the control condition, the red trace the condition after CDM administration, and the blue trace the condition after subsequent epinastine administration. To determine the combined effect of noise and non-linearities induced by the pharmacological manipulation the coherence was determined between the mean response of the control condition and each individual recording after CDM application (green), and between the mean response following CDM application and each individual recording after subsequent epinastine application (purple). Right: Coherence values averaged in an interval from 0.5 to 30 Hz, as indicated by the shaded area in (A). See legend of Figure 3 for an explanation of Box-Whisker plots. Note that, for conciseness, “Epi” is used to denote the condition in which epinastine was administered after application of CDM. (B) The same analysis for the contralateral side. The asterisks represent statistical significance at the 5% significance level (Wilcoxon signed rank test, N = 14).

