Figure 8.
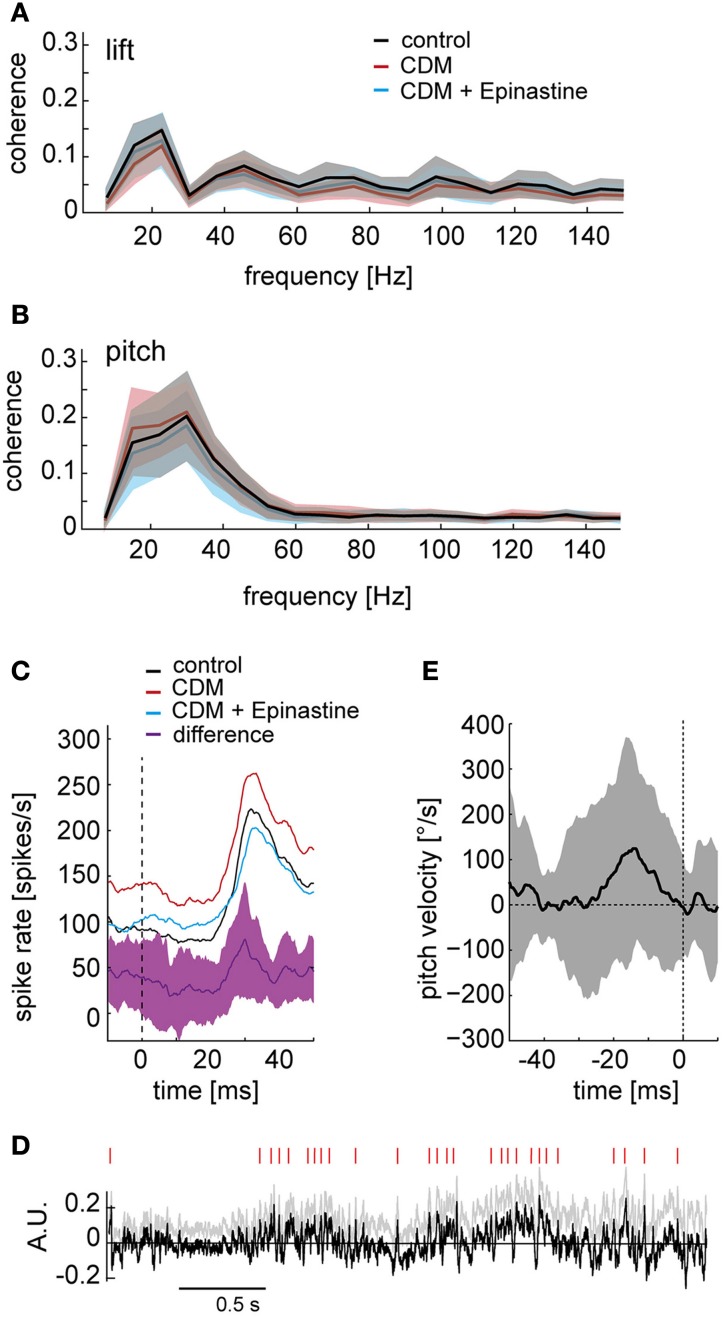
Octopaminergic modulation of responses to particular self-motion parameters. (A) Coherences between the lift translation in intersaccadic intervals and the neuronal responses. Control condition depicted in black, after CDM application in red, and after subsequent epinastine application in blue. The shaded areas indicate the standard deviations. (B) The same analysis for pitch rotation. (C) Responses to high velocities around the pitch rotation axis (pitch saccades) shown for the contralateral V1 averaged across all recordings and flies. The black line shows the average response of the control recordings, red line after CDM application, blue line after subsequent epinastine application. The purple line indicates the average difference between the responses after CDM application and following subsequent epinastine application. The shaded area depicts the standard deviation of the response difference. The vertical dashed line marks the time point of the pitch saccade's peak velocity. (D) Detection of points in time, during which the difference between the responses after CDM application and after subsequent epinastine application reaches a certain threshold. For an unbiased detection of threshold crossings, the positive slope of the normalized difference trace (gray, same data as in Figure 3A) was corrected by subtracting the regression line (see gray lines in Figure 3A), resulting in the trace shown in black. Red dashes on top indicate when the signal crosses a threshold of 1.7 times the standard deviation. (E) Average pitch velocity around the time points of threshold crossings of the difference signal (marked by the vertical dashed line at time “0”). Standard deviation indicated by shaded area. All data for the contralateral side.

