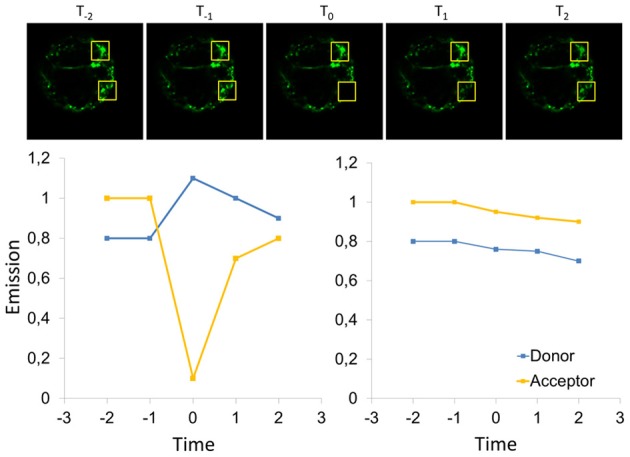
Figure 10.

Scheme for FRET-measurement by acceptor bleaching. For determination of the FRET-efficiency by acceptor bleaching, the acceptor is bleached in a defined area of the cell before time point T0, and the emission of donor and acceptor is recorded subsequent bleaching. In addition, a region of interest is considered that has not been bleached (upper row) and allows for correction of fluctuations of the cellular fluorescence, e.g., it is expected that some bleaching occurs in the entire cells (right panel). In the bleached area, the acceptor emission decreases and the emission of the donor increases since FRET does not contribute to relaxation of the donor anymore. At later time points (T1 and T2) fluorescence recovery might be observable depending on the diffusional properties of the analyzed proteins, so that acceptor bleaching connects FRET to mobility measurements by fluorescence recovery after photobleaching (FRAP). Accordingly, highly mobile proteins prevent FRET-measurements by acceptor bleaching, if the recovery is faster than image acquisition subsequent bleaching.
