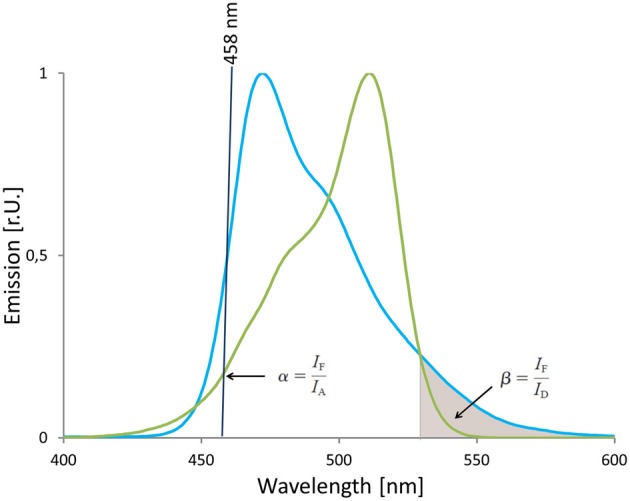
Figure 12.

Estimation of correction factors for donor cross talk and acceptor's direct excitation. The absorption spectrum of mVenus and the emission spectrum of mTurquoise2 are shown. The 458 nm laser line (black line) that is used for excitation of mTurquoise2 is in the wavelength range that is covered by the absorption spectrum of mVenus, too. On the other hand, the emission spectrum of mTurquoise2 overlaps with the emission spectrum of mVenus and is also detected in the FRET-channel as indicated by the gray area below the mTurquoise2 emission spectrum. Thus, the factors α and β correct for acceptor's direct excitation at donor's excitation wave length and donor crosstalk into the FRET-channel. The correction factors α and β are calculated based on data sets from cells that express solely mVenus or mTurquoise2, respectively.
