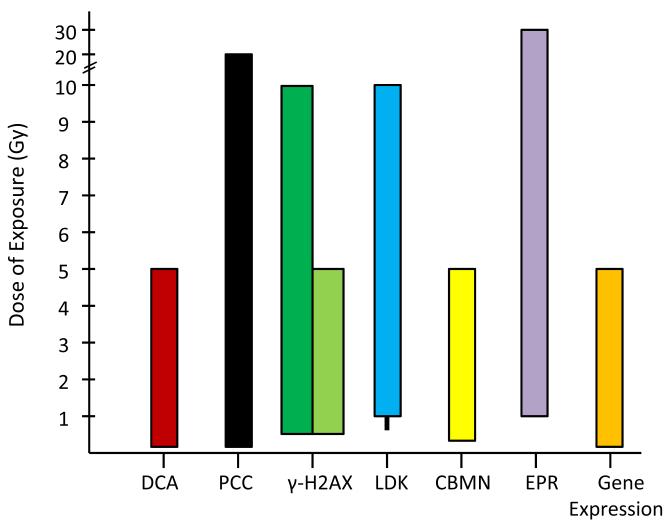
Fig.1. Dose range in which the indicated assays are able to estimate absorbed radiation dose.
The dotted line represents conflicting dose estimate reports for the LDK assay which indicate the range begins at either 0.5 or 1 Gy. For the gamma-H2AX method; the black column represents the dose range for the microscopy method, and the white column is representative of the dose range for the flow cytometry method of measurement.

