
Figure 1.
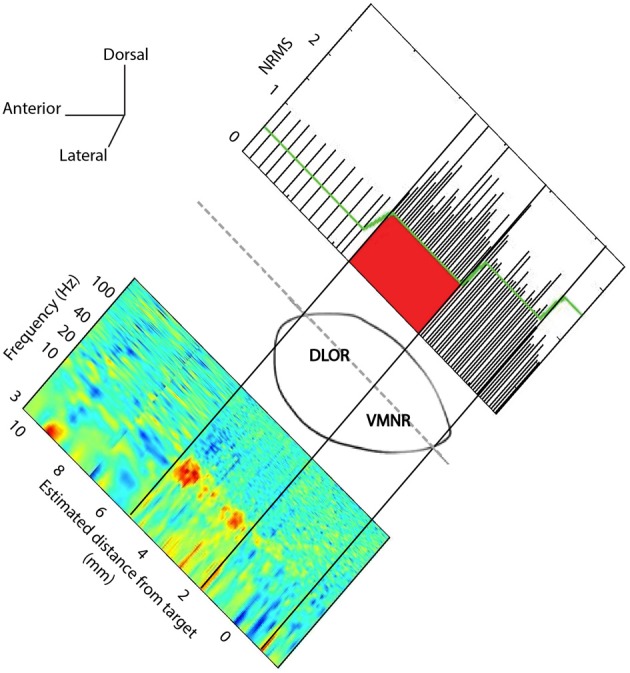
STN trajectory and analysis of microelectrode recordings (MER). The parasagittal plane of the STN (atlas of Schaltenbrand and Wahren, 1977) is represented at laterality of 12 mm with respect to the AC-PC line. Normalized root mean square (NRMS) was computed on the MER to delineate the STN boundaries (upper image). The x-axis is the estimated distance of MER from the STN target as defined on the pre-operative MRI image. Power spectral density was computed at each MER site, and a spectrogram visualizing the change of oscillatory activity with location before and within the STN is presented (lower image).