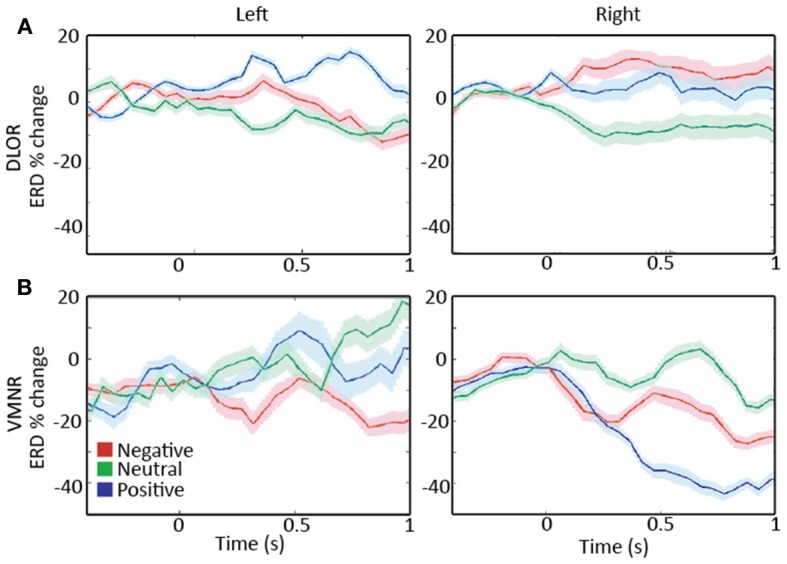
Figure 5.

A comparison of responses to emotive stimulation in subthalamic nucleus (STN) regions. (A) Left and right dorso-lateral oscillatory regions (DLOR), 5 STNs, 7 data segments, and 3 STNs, 4 data segments, respectively. (B) Left and right ventro-medial non-oscillatory regions (VMNR, 5 STNs, 8 data segments, and 4 STNs, 10 data segments, respectively). A steep reduction in the oscillatory activity is present in the right STN VMNR for positive voices (B, right), but not for neutral voices and less for negative voices. Such responses are not observed for emotive voice stimuli in the left VMNR (B, left) or left or right STN DLOR (A). Color coding: Red, green, and blue responses to negative, neutral, and positive emotive voices, respectively. Solid lines represent the mean of the event related desynchronization change (ERD), and the surrounding shaded area represents the response standard error of the mean (SEM).
