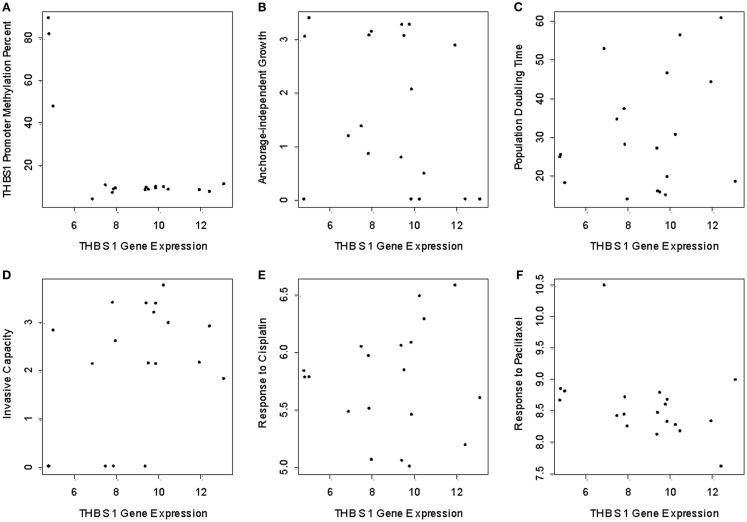
Figure 2.
THBS1 gene expression, THBS1 promoter methylation, tumor growth properties, and chemotherapy-induced growth inhibition. Pyrosequencing shows low levels of methylation in the cell lines (median = 8.6%; range = 3.5 to 88.8%). (A) Cells with low levels of promoter methylation exhibited higher THBS1 gene expression, while those with high levels of promoter methylation had low THBS1 gene expression. There was no association between THBS1 gene expression with anchorage-independent growth; (B) population doubling time (C) invasive capacity; (D) or cisplatin; (E) and paclitaxel; (F) IC50 values.

