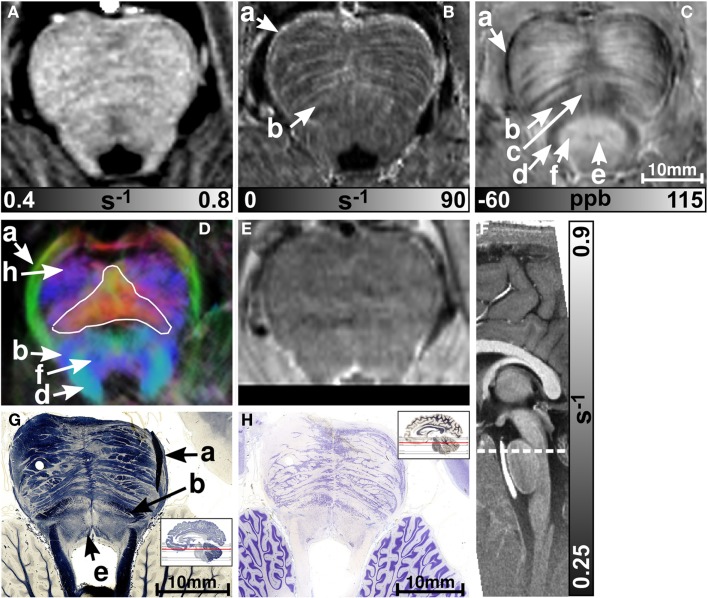
Figure 3.
Images of the rostral part of the pons. R1, , and susceptibility maps as well as direction-encoded track-density (same color-encoding as in Figure 1; slightly distorted compared to the other axial image contrasts) and T2-weighted images of the same region are presented in axial orientation from (A–E), respectively. The sectional plane of the axial images is indicated by the dashed line overlaid on the sagittal R1 map shown in (F). Axial histological sections from a different subject stained for myelin and cells are illustrated in (G) and (H), respectively. The arrows in the images indicate: (a) middle cerebellar peduncle, (b) medial lemniscus, (c) reticulotegmental nucleus, (d) superior cerebellar peduncle, (e) medial longitudinal fasciculus, (f) central tegmental tract, and (h) corticospinal tract. The solid white outline in (D) indicates the pontocerebellar fibers. [The histological stains (G,H) were adapted with permission from http://www.brains.rad.msu.edu and http://brainmuseum.org, supported by the US National Science Foundation.]

